Dollar General 2004 Annual Report Download - page 36
Download and view the complete annual report
Please find page 36 of the 2004 Dollar General annual report below. You can navigate through the pages in the report by either clicking on the pages listed below, or by using the keyword search tool below to find specific information within the annual report.-
 1
1 -
2
-
3
-
4
-
5
-
6
-
7
-
8
-
9
-
10
-
11
-
12
-
13
-
14
-
15
-
16
-
17
-
18
-
19
-
20
-
21
-
22
-
23
-
24
-
25
-
 26
26 -
 27
27 -
 28
28 -
 29
29 -
 30
30 -
 31
31 -
 32
32 -
 33
33 -
 34
34 -
 35
35 -
 36
36 -
 37
37 -
 38
38 -
 39
39 -
 40
40 -
 41
41 -
 42
42 -
 43
43 -
 44
44 -
 45
45 -
 46
46 -
47
-
48
-
49
-
50
-
51
-
52
-
53
-
54
-
55
-
56
-
57
-
58
-
59
-
60
-
61
-
62
-
63
-
64
-
65
-
66
 |
 |

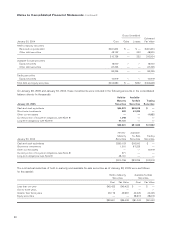
34
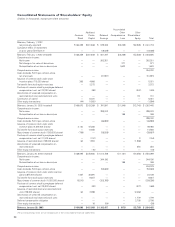
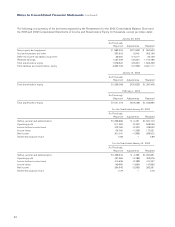
Consolidated Statements of Shareholders’ Equity
(Dollarsinthousands,exceptpershareamounts)
Common
Stock
Additional
Paid-in
Capital
Retained
Earnings
Accumulated
Other
Comprehensive
Loss
Other
Shareholders’
Equity Total
Balances, February 1, 2002
(as previously reported) $166,359 $301,848 $ 579,265 $(3,228) $(2,526) $ 1,041,718
Cumulative effect of restatement
on prior years (See Note 2) — — (18,028) — — (18,028)
Balances, February 1, 2002 (restated) $166,359 $301,848 $ 561,237 $(3,228) $(2,526) $ 1,023,690
Comprehensive income:
Net income — — 262,351 — — 262,351
Net change in fair value of derivatives — — — 277 — 277
Reclassification of net loss on derivatives — — — 1,602 — 1,602
Comprehensive income 264,230
Cash dividends, $0.13 per common share,
net of accruals — — (31,991) — — (31,991)
Issuance of common stock under stock
incentive plans (710,000 shares) 355 4,666 — — — 5,021
Tax benefit from stock option exercises — 2,372 — — — 2,372
Purchase of common stock by employee deferred
compensation trust, net (27,000 shares) — (98) — — (347) (445)
Amortization of unearned compensation on
restricted stock and restricted stock units — — — — 131 131
Contribution of capital — 6,031 — — — 6,031
Other equity transactions (44) (1,550) — — — (1,594)
Balances, January 31, 2003 (restated) $166,670 $313,269 $ 791,597 $ (1,349) $ (2,742) $ 1,267,445
Comprehensive income:
Net income — — 299,002 — — 299,002
Reclassification of net loss on derivatives — — — 188 — 188
Comprehensive income 299,190
Cash dividends, $0.14 per common share — — (46,883) — — (46,883)
Issuance of common stock under stock
incentive plans (4,240,000 shares) 2,120 47,365 — — — 49,485
Tax benefit from stock option exercises — 14,565 — — — 14,565
Repurchases of common stock (1,519,000 shares) (759) — (28,928) — — (29,687)
Purchase of common stock by employee deferred
compensation trust, net (11,000 shares) — (157) — — 3 (154)
Issuance of restricted stock (129,000 shares) 64 1,904 — — (1,968) —
Amortization of unearned compensation on
restricted stock — — — — 354 354
Other equity transactions — (16) — — — (16)
Balances, January 30, 2004 (restated) $168,095 $376,930 $ 1,014,788 $ (1,161) $(4,353) $ 1,554,299
Comprehensive income:
Net income — — 344,190 — — 344,190
Reclassification of net loss on derivatives — — — 188 — 188
Comprehensive income 344,378
Cash dividends, $0.16 per common share — — (52,682) — — (52,682)
Issuance of common stock under stock incentive
plans (2,875,000 shares) 1,437 32,691 — — — 34,128
Tax benefit from stock option exercises — 9,657 — — — 9,657
Repurchases of common stock (11,020,000 shares) (5,510) — (203,785) — — (209,295)
Purchase of common stock by employee deferred
compensation trust, net (25,000 shares) — (92) — — (377) (469)
Issuance of restricted stock and restricted stock
units (128,000 shares) 64 2,398 — — (2,462) —
Amortization of unearned compensation on
restricted stock and restricted stock units — — — — 1,779 1,779
Deferred compensation obligation — — — 2,708 2,708
Other equity transactions — 16 (54) — — (38)
Balances, January 28, 2005 $164,086 $421,600 $ 1,102,457 $ (973) $(2,705) $ 1,684,465
The accompanying notes are an integral part of the consolidated financial statements.