Dollar General 2004 Annual Report Download - page 58
Download and view the complete annual report
Please find page 58 of the 2004 Dollar General annual report below. You can navigate through the pages in the report by either clicking on the pages listed below, or by using the keyword search tool below to find specific information within the annual report.-
 1
1 -
2
-
3
-
4
-
5
-
6
-
7
-
8
-
9
-
10
-
11
-
12
-
13
-
14
-
15
-
16
-
17
-
18
-
19
-
20
-
21
-
22
-
23
-
24
-
25
-
26
-
27
-
28
-
29
-
30
-
31
-
32
-
33
-
34
-
35
-
36
-
37
-
38
-
39
-
40
-
41
-
42
-
43
-
44
-
45
-
46
-
47
-
 48
48 -
 49
49 -
 50
50 -
 51
51 -
 52
52 -
 53
53 -
 54
54 -
 55
55 -
 56
56 -
 57
57 -
 58
58 -
 59
59 -
 60
60 -
 61
61 -
 62
62 -
 63
63 -
 64
64 -
 65
65 -
 66
66
 |
 |

56
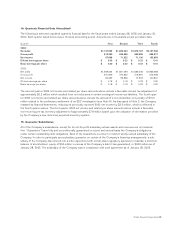
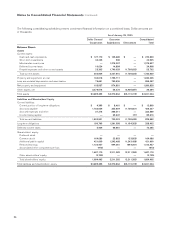
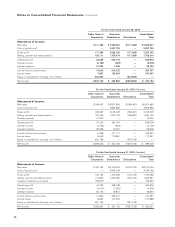
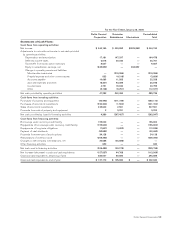
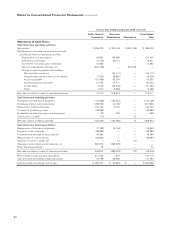
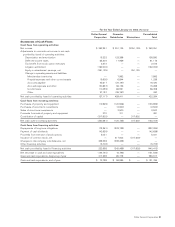
Notes to Consolidated Financial Statements (continued)
The following consolidating schedules present condensed financial information on a combined basis. Dollar amounts are
in thousands.
As of January 28, 2005
Dollar General
Corporation
Guarantor
Subsidiaries Eliminations
Consolidated
Total
Balance Sheet:
Assets
Current assets:
Cash and cash equivalents $ 127,170 $ 105,660 $ — $ 232,830
Short-term investments 42,425 500 — 42,925
Merchandise inventories — 1,376,537 — 1,376,537
Deferred income taxes 10,024 14,884 — 24,908
Prepaid expenses and other current assets 23,305 1,740,029 (1,709,632) 53,702
Total current assets 202,924 3,237,610 (1,709,632) 1,730,902
Property and equipment, at cost 184,618 1,755,717 — 1,940,335
Less accumulated depreciation and amortization 78,661 780,836 — 859,497
Net property and equipment 105,957 974,881 — 1,080,838
Other assets, net 3,376,578 58,373 (3,405,687) 29,264
Total assets $ 3,685,459 $4,270,864 $(5,115,319) $2,841,004
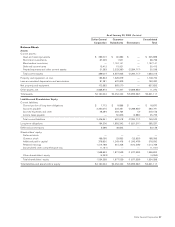
Liabilities and Shareholders’ Equity
Current liabilities:
Current portion of long-term obligations $ 4,399 $ 8,461 $ — $ 12,860
Accounts payable 1,763,024 355,904 (1,709,601) 409,327
Accrued expenses and other 37,378 296,511 — 333,889
Income taxes payable — 69,647 (31) 69,616
Total current liabilities 1,804,801 730,523 (1,709,632) 825,692
Long-term obligations 190,769 1,261,998 (1,194,305) 258,462
Deferred income taxes 5,424 66,961 — 72,385
Shareholders’ equity:
Preferred stock — — — —
Common stock 164,086 23,853 (23,853) 164,086
Additional paid-in capital 421,600 1,243,468 (1,243,468) 421,600
Retained earnings 1,102,457 944,061 (944,061) 1,102,457
Accumulated other comprehensive loss (973) — — (973)
1,687,170 2,211,382 (2,211,382) 1,687,170
Other shareholders’ equity (2,705) — — (2,705)
Total shareholders’ equity 1,684,465 2,211,382 (2,211,382) 1,684,465
Total liabilities and shareholders’ equity $ 3,685,459 $4,270,864 $(5,115,319) $2,841,004