Dollar General 2004 Annual Report Download - page 47
Download and view the complete annual report
Please find page 47 of the 2004 Dollar General annual report below. You can navigate through the pages in the report by either clicking on the pages listed below, or by using the keyword search tool below to find specific information within the annual report.-
 1
1 -
2
-
3
-
4
-
5
-
6
-
7
-
8
-
9
-
10
-
11
-
12
-
13
-
14
-
15
-
16
-
17
-
18
-
19
-
20
-
21
-
22
-
23
-
24
-
25
-
26
-
27
-
28
-
29
-
30
-
31
-
32
-
33
-
34
-
35
-
36
-
 37
37 -
 38
38 -
 39
39 -
 40
40 -
 41
41 -
 42
42 -
 43
43 -
 44
44 -
 45
45 -
 46
46 -
 47
47 -
 48
48 -
 49
49 -
 50
50 -
 51
51 -
 52
52 -
 53
53 -
 54
54 -
 55
55 -
 56
56 -
 57
57 -
58
-
59
-
60
-
61
-
62
-
63
-
64
-
65
-
66
 |
 |

Dollar General Corporation 45
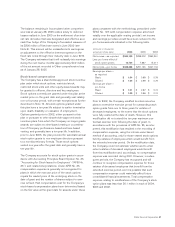
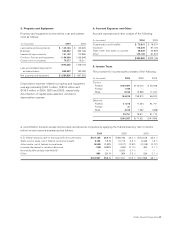
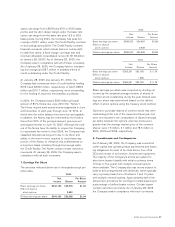
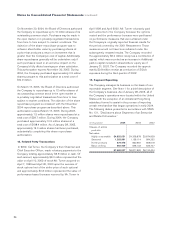
3. Property and Equipment
Property and equipment is recorded at cost and summa-
rized as follows:
(In thousands) 2004 2003
Land and land improvements $ 145,194 $ 145,605
Buildings 333,667 333,765
Leasehold improvements 191,103 170,895
Furniture, fixtures and equipment 1,196,094 1,039,946
Construction in progress 74,277 19,511
1,940,335 1,709,722
Less accumulated depreciation
and amortization 859,497 752,090
Net property and equipment $ 1,080,838 $ 957,632
Depreciation expense related to property and equipment
was approximately $163.1 million, $150.9 million and
$139.0 million in 2004, 2003 and 2002, respectively.
Amortization of capital lease assets is included in
depreciation expense.
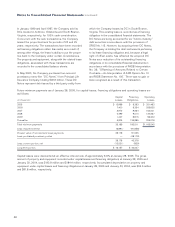
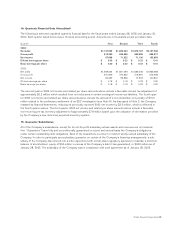
4. Accrued Expenses and Other
Accrued expenses and other consist of the following:
(In thousands) 2004 2003
Compensation and benefits $ 72,815 $ 78,374
Insurance 118,326 97,104
Taxes (other than taxes on income) 39,639 35,859
Other 103,109 91,819
$ 333,889 $ 303,156
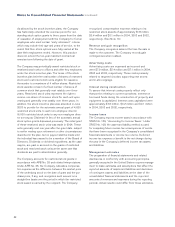
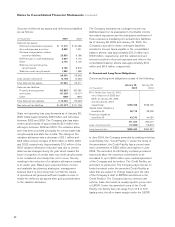
5. Income Taxes
The provision for income taxes consists of the following:
(In thousands) 2004 2003 2002
Current:
Federal $155,497 $145,072 $ 55,646
Foreign 1,169 — —
State 8,150 13,838 11,167
164,816 158,910 66,813
Deferred:
Federal 21,515 17,224 81,741
Foreign 21 — —
State 4,215 1,387 (568)
25,751 18,611 81,173
$190,567 $177,521 $147,986
A reconciliation between actual income taxes and amounts computed by applying the federal statutory rate to income
before income taxes is summarized as follows:
2004 2003 2002
U.S. federal statutory rate on earnings before income taxes $187,165 35.0 % $166,783 35.0 % $143,618 35.0 %
State income taxes, net of federal income tax benefit 8,168 1.5 % 10,773 2.3 % 6,426 1.6 %
Jobs credits, net of federal income taxes (5,544) (1.0)% (3,817) (0.8)% (2,745) (0.7)%
Increase (decrease) in valuation allowance (106) (0.0)% (582) (0.1)% 463 0.1 %
Non-deductible penalty (see Note 8) — — 3,500 0.7 % — —
Other 884 0.1 % 864 0.2 % 224 0.1 %
$190,567 35.6 % $177,521 37.3 % $147,986 36.1 %