Dollar General 2004 Annual Report Download - page 35
Download and view the complete annual report
Please find page 35 of the 2004 Dollar General annual report below. You can navigate through the pages in the report by either clicking on the pages listed below, or by using the keyword search tool below to find specific information within the annual report.-
 1
1 -
2
-
3
-
4
-
5
-
6
-
7
-
8
-
9
-
10
-
11
-
12
-
13
-
14
-
15
-
16
-
17
-
18
-
19
-
20
-
21
-
22
-
23
-
24
-
 25
25 -
 26
26 -
 27
27 -
 28
28 -
 29
29 -
 30
30 -
 31
31 -
 32
32 -
 33
33 -
 34
34 -
 35
35 -
 36
36 -
 37
37 -
 38
38 -
 39
39 -
 40
40 -
 41
41 -
 42
42 -
 43
43 -
 44
44 -
 45
45 -
46
-
47
-
48
-
49
-
50
-
51
-
52
-
53
-
54
-
55
-
56
-
57
-
58
-
59
-
60
-
61
-
62
-
63
-
64
-
65
-
66
 |
 |

Dollar General Corporation 33
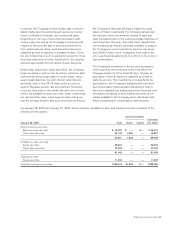
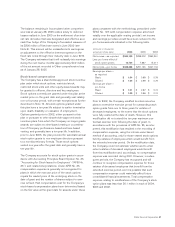
Consolidated Statements of Income
(Dollarsinthousands,exceptpershareamounts)
For the Years Ended
January 28,
2005
January 30,
2004
January 31,
2003
(Restated) (Restated)
Net sales $7,660,927 $6,871,992 $6,100,404
Cost of goods sold 5,397,735 4,853,863 4,376,138
Gross profit 2,263,192 2,018,129 1,724,266
Selling, general and administrative 1,706,216 1,500,103 1,300,831
Penalty expense and litigation settlement proceeds — 10,000 (29,541)
Operating profit 556,976 508,026 452,976
Interest income (6,575) (4,103) (4,305)
Interest expense 28,794 35,606 46,944
Income before income taxes 534,757 476,523 410,337
Income taxes 190,567 177,521 147,986
Net income $ 344,190 $ 299,002 $ 262,351
Earnings per share:
Basic $ 1.04 $ 0.89 $ 0.79
Diluted $ 1.04 $ 0.89 $ 0.78
Weighted average shares:
Basic 329,376 334,697 333,055
Diluted 332,068 337,636 335,050
The accompanying notes are an integral part of the consolidated financial statements.