Dollar General 2004 Annual Report Download - page 55
Download and view the complete annual report
Please find page 55 of the 2004 Dollar General annual report below. You can navigate through the pages in the report by either clicking on the pages listed below, or by using the keyword search tool below to find specific information within the annual report.-
 1
1 -
2
-
3
-
4
-
5
-
6
-
7
-
8
-
9
-
10
-
11
-
12
-
13
-
14
-
15
-
16
-
17
-
18
-
19
-
20
-
21
-
22
-
23
-
24
-
25
-
26
-
27
-
28
-
29
-
30
-
31
-
32
-
33
-
34
-
35
-
36
-
37
-
38
-
39
-
40
-
41
-
42
-
43
-
44
-
 45
45 -
 46
46 -
 47
47 -
 48
48 -
 49
49 -
 50
50 -
 51
51 -
 52
52 -
 53
53 -
 54
54 -
 55
55 -
 56
56 -
 57
57 -
 58
58 -
 59
59 -
 60
60 -
 61
61 -
 62
62 -
 63
63 -
 64
64 -
 65
65 -
66
 |
 |

Dollar General Corporation 53
subject to accelerated vesting as provided in Mr. Perdue’s
Employment Agreement or in the plan. The option will
terminate no later than 10 years from the grant date.
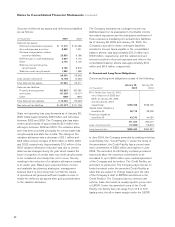
Pro forma information regarding net income and earnings
per share, as disclosed in Note 1, has been determined
as if the Company had accounted for its employee stock-
based compensation plans under the fair value method of
SFAS No. 123. The fair value of options granted during
2004, 2003 and 2002 was $6.36, $5.45 and $6.15,
respectively. The fair value of each stock option grant was
estimated on the date of grant using the Black-Scholes
option-pricing model with the following assumptions:
2004 2003 2002
Expected dividend yield 0.9% 0.9% 0.8%
Expected stock price volatility 35.5% 36.9% 35.3%
Weighted average risk-free
interest rate 3.5% 2.7% 3.9%
Expected life of options (years) 5.0 3.7 6.5
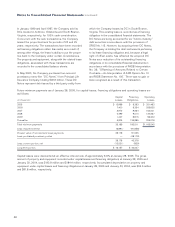
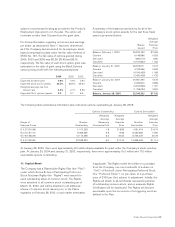
A summary of the balances and activity for all of the
Company’s stock option awards for the last three fiscal
years is presented below:
Shares
Issued
Weighted
Average
Exercise
Price
Balance, February 1, 2002 25,970,762 $15.65
Granted 4,146,986 15.83
Exercised (690,515) 6.90
Canceled (2,510,662) 17.35
Balance, January 31, 2003 26,916,571 15.73
Granted 4,705,586 18.39
Exercised (4,240,438) 11.68
Canceled (2,450,429) 17.76
Balance, January 30, 2004 24,931,290 16.75
Granted 2,250,900 18.88
Exercised (2,874,828) 11.87
Canceled (1,758,030) 18.97
Balance, January 28, 2005 22,549,332 $17.42
The following table summarizes information about all stock options outstanding at January 28, 2005:
Options Outstanding Options Exercisable
Range of
Exercise Prices
Number
Outstanding
Weighted
Average
Remaining
Contractual Life
Weighted
Average
Exercise
Price
Number
Exercisable
Weighted
Average
Exercise
Price
$ 4.27–$10.68 1,107,229 1.8 $ 6.83 1,051,419 $ 6.74
$10.73–$17.31 9,268,565 5.9 14.86 6,060,665 14.90
$17.64–$23.90 12,173,538 6.4 20.33 6,724,375 20.78
$ 4.27–$23.90 22,549,332 6.0 $17.42 13,836,459 $17.14
At January 28, 2005, there were approximately 8.3 million shares available for grant under the Company’s stock incentive
plan. At January 30, 2004 and January 31, 2003, respectively, there were approximately 15.0 million and 17.0 million
exercisable options outstanding.
11. Capital Stock
The Company has a Shareholder Rights Plan (the “Plan”)
under which Series B Junior Participating Preferred
Stock Purchase Rights (the “Rights”) were issued for
each outstanding share of common stock. The Rights
were attached to all common stock outstanding as of
March 10, 2000, and will be attached to all additional
shares of common stock issued prior to the Plan’s
expiration on February 28, 2010, or such earlier termination,
if applicable. The Rights entitle the holders to purchase
from the Company one one-hundredth of a share (a
“Unit”) of Series B Junior Participating Preferred Stock
(the “Preferred Stock”), no par value, at a purchase
price of $100 per Unit, subject to adjustment. Initially, the
Rights will attach to all certificates representing shares
of outstanding common stock, and no separate Rights
Certificates will be distributed. The Rights will become
exercisable upon the occurrence of a triggering event as
defined in the Plan.