Dollar General 2004 Annual Report Download - page 20
Download and view the complete annual report
Please find page 20 of the 2004 Dollar General annual report below. You can navigate through the pages in the report by either clicking on the pages listed below, or by using the keyword search tool below to find specific information within the annual report.-
 1
1 -
2
-
3
-
4
-
5
-
6
-
7
-
8
-
9
-
 10
10 -
 11
11 -
 12
12 -
 13
13 -
 14
14 -
 15
15 -
 16
16 -
 17
17 -
 18
18 -
 19
19 -
 20
20 -
 21
21 -
 22
22 -
 23
23 -
 24
24 -
 25
25 -
 26
26 -
 27
27 -
 28
28 -
 29
29 -
 30
30 -
31
-
32
-
33
-
34
-
35
-
36
-
37
-
38
-
39
-
40
-
41
-
42
-
43
-
44
-
45
-
46
-
47
-
48
-
49
-
50
-
51
-
52
-
53
-
54
-
55
-
56
-
57
-
58
-
59
-
60
-
61
-
62
-
63
-
64
-
65
-
66
 |
 |
18
Management’s Discussion and Analysis of Financial Condition
and Results of Operations (continued)
increased number of physical inventories and a higher
average cost per physical inventory. Partially offsetting
these increases was a reduction in accruals for employee
bonus expenses (declined 21.3%) primarily related to
higher bonus expense in 2003 related to the Company’s
financial performance during 2003.
The increase in SG&A expense as a percentage of sales,
excluding expenses relating to the 2001 Restatement
(primarily professional fees), in 2003 as compared with
2002 was due to a number of factors, including but not
limited to increases in the following expense categories
that were in excess of the 12.6 percentage increase in
sales: store labor (increased 14.6%) primarily due to
increases in store training-related costs; the cost of
workers’ compensation and other insurance programs
(increased 29.8%) primarily due to an increase in medical
inflation costs experienced by the Company compared to
previous years; store occupancy costs (increased 16.0%)
primarily due to rising average monthly rentals associated
with the Company’s leased store locations; and higher
bonus expense (increased 34.4%) related to the
Company’s financial performance during 2003.
Penalty Expense and Litigation Settlement
Proceeds. As more fully discussed in Note 8 to the
Consolidated Financial Statements, the Company accrued
$10.0 million in 2003 with respect to a civil penalty
related to its agreement in principle with the Securities
and Exchange Commission (“SEC”) staff to settle the
matters arising out of the Company’s 2001 Restatement.
In 2002, the Company recorded $29.5 million in net
litigation settlement proceeds, which amount included
$29.7 million in insurance proceeds associated with the
settlement of class action and shareholder derivative
litigation, offset by a $0.2 million settlement of a share-
holder class action opt-out claim, all of which related to
the 2001 Restatement.
Interest Expense. The decrease in interest expense
in 2004 compared to 2003 is due primarily to capitalized
interest of $3.6 million related to the Company’s DC
construction and expansion projects in 2004 compared
to $0.2 million in 2003 and a reduction in amortization of
debt issuance costs of $2.2 million due in part to the
amendment of the Company’s revolving credit facility in
June 2004. The decrease in interest expense in 2003
as compared to 2002 is due primarily to debt reduction
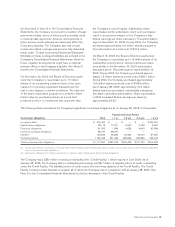
achieved during 2003. The average daily total debt
outstanding over the past three years was as follows:
2004–$280.1 million at an average interest rate of 8.5%;
2003–$301.5 million at an average interest rate of 8.6%;
and 2002–$575.7 million at an average interest rate of
6.6%. The increase in the Company’s average interest
rate from 2002 to 2003 is due primarily to the reduction
of variable rate debt. All of the Company’s outstanding
indebtedness at January 28, 2005 and January 30, 2004
was fixed rate debt.
Income Taxes. The effective income tax rates for 2004,
2003 and 2002 were 35.6%, 37.3% and 36.1%, respectively.
The 2004 rate was lower than the 2003 rate primarily
due to a net reduction in certain contingent income tax
liabilities of approximately $6.2 million recognized in the
second quarter of 2004, when the Company adjusted its
tax contingency reserve as the result of two state income
tax examinations. The tax rate in 2003 was negatively
impacted by the $10.0 million penalty expense in 2003,
as discussed above, which was not deductible for income
tax purposes. The lower effective tax rate in 2002 was
primarily due to the favorable resolution of certain state
tax related items during 2002.
Liquidity and Capital Resources
Current Financial Condition/Recent
Developments. During the past three years, the
Company has generated an aggregate of approximately
$1.33 billion in cash flows from operating activities.
During that period, the Company has expanded the
number of stores it operates by 32% (1,780 stores) and
has incurred approximately $566 million in capital expen-
ditures, primarily to support this growth. Also during
this three-year period, the Company has reduced its
long-term debt by approximately $464 million and has
expended approximately $239 million for repurchases
of its common stock.
The Company’s inventory balance represented approxi-
mately 48% of its total assets as of January 28, 2005.
The Company’s proficiency in managing its inventory
balances can have a significant impact on the Company’s
cash flows from operations during a given fiscal year.
For example, in 2004, changes in inventory balances
represented a $219.4 million use of cash, as explained
in more detail below, while in 2002, changes in inventory
balances represented an $8.0 million source of cash.
Inventory turns increased from 3.8 times in 2002 to
4.0 times in both 2003 and 2004.