Cigna 2012 Annual Report Download - page 90
Download and view the complete annual report
Please find page 90 of the 2012 Cigna annual report below. You can navigate through the pages in the report by either clicking on the pages listed below, or by using the keyword search tool below to find specific information within the annual report.-
 1
1 -
2
-
3
-
4
-
5
-
6
-
7
-
8
-
9
-
10
-
11
-
12
-
13
-
14
-
15
-
16
-
17
-
18
-
19
-
20
-
21
-
22
-
23
-
24
-
25
-
26
-
27
-
28
-
29
-
30
-
31
-
32
-
33
-
34
-
35
-
36
-
37
-
38
-
39
-
40
-
41
-
42
-
43
-
44
-
45
-
46
-
47
-
48
-
49
-
50
-
51
-
52
-
53
-
54
-
55
-
56
-
57
-
58
-
59
-
60
-
61
-
62
-
63
-
64
-
65
-
66
-
67
-
68
-
69
-
70
-
71
-
72
-
73
-
74
-
75
-
76
-
77
-
78
-
79
-
 80
80 -
 81
81 -
 82
82 -
 83
83 -
 84
84 -
 85
85 -
 86
86 -
 87
87 -
 88
88 -
 89
89 -
 90
90 -
 91
91 -
 92
92 -
 93
93 -
 94
94 -
 95
95 -
 96
96 -
 97
97 -
 98
98 -
 99
99 -
 100
100 -
101
-
102
-
103
-
104
-
105
-
106
-
107
-
108
-
109
-
110
-
111
-
112
-
113
-
114
-
115
-
116
-
117
-
118
-
119
-
120
-
121
-
122
-
123
-
124
-
125
-
126
-
127
-
128
-
129
-
130
-
131
-
132
-
133
-
134
-
135
-
136
-
137
-
138
-
139
-
140
-
141
-
142
-
143
-
144
-
145
-
146
-
147
-
148
-
149
-
150
-
151
-
152
-
153
-
154
-
155
-
156
-
157
-
158
-
159
-
160
-
161
-
162
-
163
-
164
-
165
-
166
-
167
-
168
-
169
-
170
-
171
-
172
-
173
-
174
-
175
-
176
-
177
-
178
-
179
-
180
-
181
-
182
 |
 |

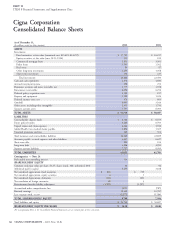
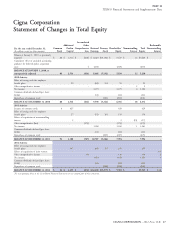
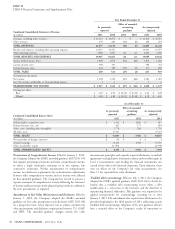
PART II
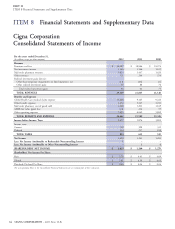
ITEM 8 Financial Statements and Supplementary Data
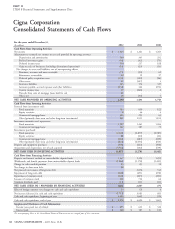
Cigna Corporation
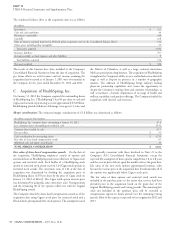
Consolidated Statements of Cash Flows
For the years ended December 31,
(In millions)
2012 2011 2010
Cash Flows from Operating Activities
Net income $ 1,624 $ 1,261 $ 1,283
Adjustments to reconcile net income to net cash provided by operating activities:
Depreciation and amortization 560 345 292
Realized investment gains (44) (62) (75)
Deferred income taxes 134 217 188
Gains on sales of businesses (excluding discontinued operations) (18) (25) (13)
Net changes in assets and liabilities, net of non-operating effects:
Premiums, accounts and notes receivable (71) (50) 62
Reinsurance recoverables 62 19 37
Deferred policy acquisition costs (159) (129) (94)
Other assets 31 (307) 3
Insurance liabilities 245 154 325
Accounts payable, accrued expenses and other liabilities (132) 344 (272)
Current income taxes 29 (246) 2
Proceeds from sales of mortgage loans held for sale 61 - -
Other, net 28 (30) 5
NET CASH PROVIDED BY OPERATING ACTIVITIES 2,350 1,491 1,743
Cash Flows from Investing Activities
Proceeds from investments sold:
Fixed maturities 583 830 822
Equity securities 846 4
Commercial mortgage loans 380 253 63
Other (primarily short-term and other long-term investments) 831 1,915 1,102
Investment maturities and repayments:
Fixed maturities 1,507 1,265 1,084
Commercial mortgage loans 342 385 70
Investments purchased:
Fixed maturities (2,326) (2,877) (2,587)
Equity securities (8) (20) (12)
Commercial mortgage loans (364) (487) (239)
Other (primarily short-term and other long-term investments) (821) (2,056) (810)
Property and equipment purchases (408) (422) (300)
Acquisitions and dispositions, net of cash acquired (3,581) (102) (539)
NET CASH USED IN INVESTING ACTIVITIES (3,857) (1,270) (1,342)
Cash Flows from Financing Activities
Deposits and interest credited to contractholder deposit funds 1,337 1,323 1,295
Withdrawals and benefit payments from contractholder deposit funds (1,264) (1,178) (1,205)
Change in cash overdraft position 25 (1) 59
Net change in short-term debt 98 - -
Net proceeds on issuance of long-term debt - 2,676 543
Repayment of long-term debt (326) (451) (270)
Repurchase of common stock (208) (225) (201)
Issuance of common stock 121 734 64
Common dividends paid (11) (11) (11)
NET CASH (USED IN) / PROVIDED BY FINANCING ACTIVITIES (228) 2,867 274
Effect of foreign currency rate changes on cash and cash equivalents 23 (3) 6
Net increase (decrease) in cash and cash equivalents (1,712) 3,085 681
Cash and cash equivalents, beginning of year 4,690 1,605 924
Cash and cash equivalents, end of year $ 2,978 $ 4,690 $ 1,605
Supplemental Disclosure of Cash Information:
Income taxes paid, net of refunds $ 655 $ 633 $ 326
Interest paid $ 248 $ 185 $ 180
The accompanying Notes to the Consolidated Financial Statements are an integral part of these statements.
68 CIGNA CORPORATION - 2012 Form 10-K