Cigna 2012 Annual Report Download - page 68
Download and view the complete annual report
Please find page 68 of the 2012 Cigna annual report below. You can navigate through the pages in the report by either clicking on the pages listed below, or by using the keyword search tool below to find specific information within the annual report.-
 1
1 -
2
-
3
-
4
-
5
-
6
-
7
-
8
-
9
-
10
-
11
-
12
-
13
-
14
-
15
-
16
-
17
-
18
-
19
-
20
-
21
-
22
-
23
-
24
-
25
-
26
-
27
-
28
-
29
-
30
-
31
-
32
-
33
-
34
-
35
-
36
-
37
-
38
-
39
-
40
-
41
-
42
-
43
-
44
-
45
-
46
-
47
-
48
-
49
-
50
-
51
-
52
-
53
-
54
-
55
-
56
-
57
-
 58
58 -
 59
59 -
 60
60 -
 61
61 -
 62
62 -
 63
63 -
 64
64 -
 65
65 -
 66
66 -
 67
67 -
 68
68 -
 69
69 -
 70
70 -
 71
71 -
 72
72 -
 73
73 -
 74
74 -
 75
75 -
 76
76 -
 77
77 -
 78
78 -
79
-
80
-
81
-
82
-
83
-
84
-
85
-
86
-
87
-
88
-
89
-
90
-
91
-
92
-
93
-
94
-
95
-
96
-
97
-
98
-
99
-
100
-
101
-
102
-
103
-
104
-
105
-
106
-
107
-
108
-
109
-
110
-
111
-
112
-
113
-
114
-
115
-
116
-
117
-
118
-
119
-
120
-
121
-
122
-
123
-
124
-
125
-
126
-
127
-
128
-
129
-
130
-
131
-
132
-
133
-
134
-
135
-
136
-
137
-
138
-
139
-
140
-
141
-
142
-
143
-
144
-
145
-
146
-
147
-
148
-
149
-
150
-
151
-
152
-
153
-
154
-
155
-
156
-
157
-
158
-
159
-
160
-
161
-
162
-
163
-
164
-
165
-
166
-
167
-
168
-
169
-
170
-
171
-
172
-
173
-
174
-
175
-
176
-
177
-
178
-
179
-
180
-
181
-
182
 |
 |

PART II
ITEM 7 Management’s Discussion and Analysis of Financial Condition and Results of Operations
The higher operating expense ratio is driven by strategic investments. Benefits and expenses include the favorable before tax impact of reserve
studies of $59 million in 2011 as compared with $55 million in 2010.
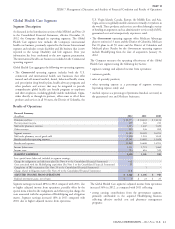
Global Supplemental Benefits Segment
Segment Description
As explained in the Introduction section of this MD&A and Note 23 to the Consolidated Financial Statements, effective December 31, 2012, the
Company changed its external reporting segments. Prior year information has been conformed to the new segment structure.
The Global Supplemental segment includes supplemental health, life and accident insurance products offered in the U.S. and foreign markets,
primarily in Asia as well as Medicare supplemental coverage following the 2012 acquisition of Great American Supplemental Benefits.
The key factors for this segment are:
premium growth, including new business and customer retention;
benefits expense as a percentage of earned premium (loss ratio);
operating expense as a percentage of earned premium (expense ratio); and
impact of foreign currency movements.
Throughout this discussion, the impact of foreign currency movements was calculated by comparing the reported results to what the results would
have been had the exchange rates remained constant with the prior year’s comparable period exchange rates.
Results of Operations
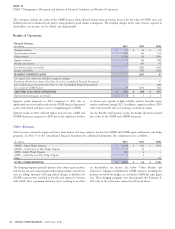
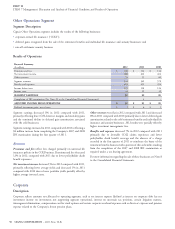
Financial Summary
(In millions)
2012 2011 2010
Premiums and fees $ 1,984 $ 1,528 $ 1,231
Net investment income 90 83 69
Other revenues 21 15 22
Segment revenues 2,095 1,626 1,322
Benefits and expenses 1,916 1,492 1,192
Income before taxes 179 134 130
Income taxes 36 36 42
Income attributable to redeemable noncontrolling interest 1 - -
Income attributable to other noncontrolling interest - 1 4
SEGMENT EARNINGS 142 97 84
Less: special items (after-tax) included in segment earnings:
Charge for realignment and efficiency plan (See Note 6 to the Consolidated Financial Statements) (6) - -
Costs associated with the acquisition of FirstAssist - (3) –
ADJUSTED INCOME FROM OPERATIONS $ 148 $ 100 $ 84
Impact of foreign currency movements using 2011 rates $ (2)
Impact of foreign currency movements using 2010 rates $ 4
Realized investment gains, net of taxes $ 1 $ 1 $ 2
Global Supplemental Benefits segment earnings increased 46% in management of solicitation spending. Excluding the first quarter
2012 compared to 2011. Segment earnings for 2012 include an 2012 implementation effect of the capital management strategy, the
after-tax charge of $6 million associated with the realignment and Global Supplemental Benefits segment’s effective tax rate for the full
efficiency plan, and an $8 million favorable adjustment related to the year 2012 was 24.6%, compared with 27.3% for 2011.
first quarter 2012 expansion of a capital management strategy to Global Supplemental Benefits segment earnings increased 15% in
permanently invest the earnings of its China and Indonesia operations 2011 compared with 2010. Segment earnings for 2010 include a
overseas (see further discussion in the Liquidity and Capital Resources $10 million unfavorable tax adjustment related to the first quarter
section of the MD&A). Excluding these adjustments and the 2010 expansion of a capital management strategy to permanently
unfavorable impact of foreign currency movements (presented in the invest the earnings of its Hong Kong operations overseas (see further
table above) adjusted income from operations increased 42% for the discussion in the Liquidity and Capital Resources section of the
2012 compared with 2011. These increases were primarily driven by MD&A). Excluding the impact of this tax adjustment and foreign
the strong revenue growth, primarily in South Korea and, to a lesser currency movements (presented in the table above), the Global
extent, margin improvement largely attributable to disciplined
46 CIGNA CORPORATION - 2012 Form 10-K
•
•
•
•