Cigna 2012 Annual Report Download - page 65
Download and view the complete annual report
Please find page 65 of the 2012 Cigna annual report below. You can navigate through the pages in the report by either clicking on the pages listed below, or by using the keyword search tool below to find specific information within the annual report.-
 1
1 -
2
-
3
-
4
-
5
-
6
-
7
-
8
-
9
-
10
-
11
-
12
-
13
-
14
-
15
-
16
-
17
-
18
-
19
-
20
-
21
-
22
-
23
-
24
-
25
-
26
-
27
-
28
-
29
-
30
-
31
-
32
-
33
-
34
-
35
-
36
-
37
-
38
-
39
-
40
-
41
-
42
-
43
-
44
-
45
-
46
-
47
-
48
-
49
-
50
-
51
-
52
-
53
-
54
-
 55
55 -
 56
56 -
 57
57 -
 58
58 -
 59
59 -
 60
60 -
 61
61 -
 62
62 -
 63
63 -
 64
64 -
 65
65 -
 66
66 -
 67
67 -
 68
68 -
 69
69 -
 70
70 -
 71
71 -
 72
72 -
 73
73 -
 74
74 -
 75
75 -
76
-
77
-
78
-
79
-
80
-
81
-
82
-
83
-
84
-
85
-
86
-
87
-
88
-
89
-
90
-
91
-
92
-
93
-
94
-
95
-
96
-
97
-
98
-
99
-
100
-
101
-
102
-
103
-
104
-
105
-
106
-
107
-
108
-
109
-
110
-
111
-
112
-
113
-
114
-
115
-
116
-
117
-
118
-
119
-
120
-
121
-
122
-
123
-
124
-
125
-
126
-
127
-
128
-
129
-
130
-
131
-
132
-
133
-
134
-
135
-
136
-
137
-
138
-
139
-
140
-
141
-
142
-
143
-
144
-
145
-
146
-
147
-
148
-
149
-
150
-
151
-
152
-
153
-
154
-
155
-
156
-
157
-
158
-
159
-
160
-
161
-
162
-
163
-
164
-
165
-
166
-
167
-
168
-
169
-
170
-
171
-
172
-
173
-
174
-
175
-
176
-
177
-
178
-
179
-
180
-
181
-
182
 |
 |

PART II
ITEM 7 Management’s Discussion and Analysis of Financial Condition and Results of Operations
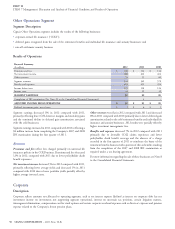
penetration of specialty products also contributed to the increase in Other revenues for the Global Health Care segment consist primarily
revenues for the U.S. commercial business. of revenues earned on direct channel sales of certain specialty
products, including behavioral health and disease management, as
These increases in premiums and fees in 2012 and 2011 reflect the well as revenues for management services provided to independent
Company’s sustained success in delivering differentiated value to its physician associations and health plans. Other revenues decreased 5%
customers with a focus on providing cost-effective products and in 2012 compared with 2011, driven primarily by the divestiture of
services that expand access and provide superior clinical outcomes. Cigna Government Services in the second quarter of 2011, partially
offset by revenue contributions from HealthSpring.
Net investment income decreased 2% in 2012 compared with 2011
reflecting lower yields, partially offset by the impact of the Other revenues decreased 12% in 2011 compared with 2010 mostly
HealthSpring acquisition and higher income from partnership due to the sale of the Cigna Government Services business in the
investments. Net investment income increased 14% in 2011 second quarter of 2011, as well as declines in certain stand-alone
compared with 2010 benefiting from increased average asset levels medical cost management business.
driven by membership growth and higher income from partnership
investments.
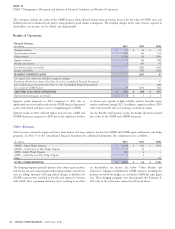
Benefits and Expenses
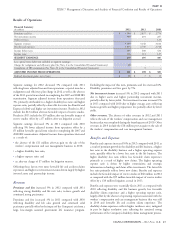
Health Care segment benefits and expenses consist of the following:
(In millions)
2012 2011 2010
Medical claims expense – excluding Medicare IPFFS $ 14,235 $ 9,144 $ 8,450
Medical claims expense – Medicare IPFFS (7) (19) 772
Medical claims expense 14,228 9,125 9,222
Mail order pharmacy cost of goods sold 1,328 1,203 1,169
Other operating expenses, excluding Medicare IPFFS and special items 5,217 4,340 4,120
Other operating expenses, Medicare IPFFS - - 82
Other operating expenses, excluding special items 5,217 4,340 4,202
Special items 96 - -
Total other operating expenses 5,313 4,340 4,202
TOTAL BENEFITS AND EXPENSES $ 20,869 $ 14,668 $ 14,593
Selected ratios
Guaranteed cost medical care ratio 80.2% 79.7% 80.1%
Medicare Advantage medical care ratio (excluding IPFFS) 80.9% 89.6% 90.9%
Medicare Part D medical care ratio 81.2% 83.4% 84.2%
Operating expense ratio – including special items and Medicare IPFFS 23.0% 26.5% 26.2%
Operating expense ratio – excluding special items and Medicare IPFFS 22.6% 26.5% 27.1%
Medical claims expense increased 56% in 2012 compared with 2011, quarter of 2011 and expense management actions taken in 2012.
primarily reflecting growth in the government segment due to the Operating expenses increased 3% in 2011 compared with 2010.
acquisition of HealthSpring, growth in the international health care Excluding the impact of the Medicare IPFFS business, operating
business driven by the conversion of Vanbreda business from service expenses increased 5% primarily due to business growth, strategic
to insurance contracts, and medical cost inflation. The guaranteed investments including brand strategy and Individual segment
cost medical care ratio is modestly higher in 2012 compared with expansion, partially offset by the impact of exiting the Medicare
2011, due to slightly higher utilization. The Medicare Advantage and IPFFS business and divestiture of Cigna Government Services.
Medicare Part D medical care ratios were lower in 2012 compared One measure of the segment’s overall operating efficiency is the
with 2011, driven by the acquisition of HealthSpring. operating expense ratio calculated as total other operating expenses
Medical claims expense decreased 1% in 2011 compared with 2010. divided by segment revenues. The table above shows the operating
Excluding the impact of Medicare IPFFS business, medical claims expense ratios for the Global Health Care Segment.
expenses increased 8% in 2011 compared with 2010, largely due to The operating expense ratios decreased for 2012 compared with 2011,
the acquisition of Vanbreda in the international health care business, primarily driven by the acquisition of HealthSpring, as well as organic
as well as medical cost inflation, tempered by low medical services revenue growth and operating expense efficiencies achieved through
utilization trend in commercial risk businesses. expense management actions taken in 2012, partially offset by higher
Operating expenses (including special items) increased by 22% in investments in technology and business initiatives. The HealthSpring
2012 compared with 2011. Excluding special items, operating acquired business largely reflects fully insured, premium-based
expenses increased by 20% in 2012 compared with 2011, primarily products with substantially lower operating expense ratios than the
due to the acquisition of HealthSpring, investments in technology, Company’s commercial businesses. The Company’s commercial
business initiatives, and customer-driven volume growth, partially businesses are heavily weighted to ASO fee-based products that have
offset by the divestiture of Cigna Government Services in the second relatively higher operating expense ratios.
CIGNA CORPORATION - 2012 Form 10-K 43