Cigna 2012 Annual Report Download - page 113
Download and view the complete annual report
Please find page 113 of the 2012 Cigna annual report below. You can navigate through the pages in the report by either clicking on the pages listed below, or by using the keyword search tool below to find specific information within the annual report.-
 1
1 -
2
-
3
-
4
-
5
-
6
-
7
-
8
-
9
-
10
-
11
-
12
-
13
-
14
-
15
-
16
-
17
-
18
-
19
-
20
-
21
-
22
-
23
-
24
-
25
-
26
-
27
-
28
-
29
-
30
-
31
-
32
-
33
-
34
-
35
-
36
-
37
-
38
-
39
-
40
-
41
-
42
-
43
-
44
-
45
-
46
-
47
-
48
-
49
-
50
-
51
-
52
-
53
-
54
-
55
-
56
-
57
-
58
-
59
-
60
-
61
-
62
-
63
-
64
-
65
-
66
-
67
-
68
-
69
-
70
-
71
-
72
-
73
-
74
-
75
-
76
-
77
-
78
-
79
-
80
-
81
-
82
-
83
-
84
-
85
-
86
-
87
-
88
-
89
-
90
-
91
-
92
-
93
-
94
-
95
-
96
-
97
-
98
-
99
-
100
-
101
-
102
-
 103
103 -
 104
104 -
 105
105 -
 106
106 -
 107
107 -
 108
108 -
 109
109 -
 110
110 -
 111
111 -
 112
112 -
 113
113 -
 114
114 -
 115
115 -
 116
116 -
 117
117 -
 118
118 -
 119
119 -
 120
120 -
 121
121 -
 122
122 -
 123
123 -
124
-
125
-
126
-
127
-
128
-
129
-
130
-
131
-
132
-
133
-
134
-
135
-
136
-
137
-
138
-
139
-
140
-
141
-
142
-
143
-
144
-
145
-
146
-
147
-
148
-
149
-
150
-
151
-
152
-
153
-
154
-
155
-
156
-
157
-
158
-
159
-
160
-
161
-
162
-
163
-
164
-
165
-
166
-
167
-
168
-
169
-
170
-
171
-
172
-
173
-
174
-
175
-
176
-
177
-
178
-
179
-
180
-
181
-
182
 |
 |

PART II
ITEM 8 Financial Statements and Supplementary Data
over comparable U.S. Treasury securities, based on the credit quality, plan’s ownership share of the equity of the investee including changes
industry and structure of the asset. in the fair values of its underlying investments.
Plan assets classified in Level 3 include securities partnerships, equity
real estate and hedge funds generally valued based on the pension
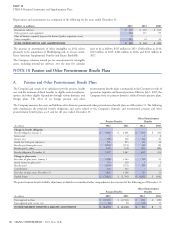
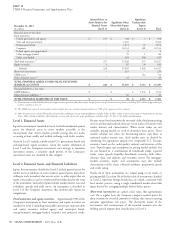
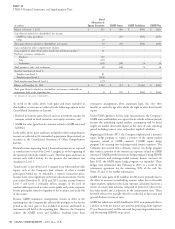
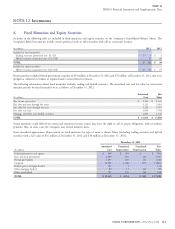
The following table summarizes the changes in pension plan assets classified in Level 3 for the years ended December 31, 2012 and December 31,
2011. Actual return on plan assets in this table may include changes in fair value that are attributable to both observable and unobservable inputs.
Fixed Guaranteed
Maturities Real Estate Deposit
& Equity & Mortgage Securities Account
(In millions)
Securities Loans Partnerships Hedge Funds Contract Total
Balance at January 1, 2012 $ 26 $ 303 $ 314 $ 148 $ 39 $ 830
Actual return on plan assets:
Assets still held at the reporting date - 38 18 10 3 69
Assets sold during the period - - - - - -
TOTAL ACTUAL RETURN ON PLAN ASSETS - 38 18 10 3 69
Purchases, sales, settlements, net 5 11 (4) 169 5 186
Transfers into/out of Level 3 13 - - - - 13
Balance at December 31, 2012 $ 44 $ 352 $ 328 $ 327 $ 47 $ 1,098
Fixed Guaranteed
Maturities Real Estate Deposit
& Equity & Mortgage Securities Account
(In millions)
Securities Loans Partnerships Hedge Fund Contract Total
Balance at January 1, 2011 $ 46 $ 240 $ 347 $ - $ 24 $ 657
Actual return on plan assets:
Assets still held at the reporting date 1 44 66 (2) 3 112
Assets sold during the period 18 - - - - 18
TOTAL ACTUAL RETURN ON PLAN ASSETS 19 44 66 (2) 3 130
Purchases, sales, settlements, net (33) 21 (99) 150 12 51
Transfers into/out of Level 3 (6) (2) - - - (8)
Balance at December 31, 2011 $ 26 $ 303 $ 314 $ 148 $ 39 $ 830
The assets related to other postretirement benefit plans are invested in they are classified as Level 3. During 2012, these assets earned a return
deposit funds with interest credited based on fixed income of $1 million, offset by a net withdrawal from the fund of $3 million,
investments in the general account of CGLIC. As there are significant while during 2011, they earned a return of $1 million, offset by a net
unobservable inputs used in determining the fair value of these assets, withdrawal of $2 million.
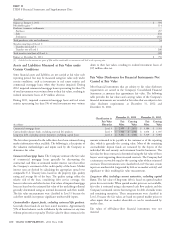
Assumptions for pension and other postretirement benefit plans. Management determined the present value of the projected benefit obligation
and the accumulated other postretirement benefit obligation and related benefit costs based on the following weighted average assumptions as of
and for the years ended December 31:
2012 2011
Discount rate:
Pension benefit obligation 3.50% 4.00%
Other postretirement benefit obligation 3.25% 3.75%
Pension benefit cost 4.00% 5.00%
Other postretirement benefit cost 3.75% 4.75%
Expected long-term return on plan assets:
Pension benefit cost 8.00% 8.00%
Other postretirement benefit cost 5.00% 5.00%
In measuring the 2012 benefit obligations, the Company set discount Company believes that the Citigroup Above-Median Pension Liability
rates by applying actual annualized yields at various durations from curve is more representative of the yields that the Company is able to
the Citigroup Above-Median Pension Liability curve to the expected achieve in its plan asset investment strategy. The curve uses an array of
cash flows of the postretirement benefits liabilities. Prior to 2012, the bonds in various industries throughout the domestic market for high
Company used the broader Cititgroup Pension Liability curve. The quality bonds, but only selects those for the curve that have an above
CIGNA CORPORATION - 2012 Form 10-K 91