Cigna 2012 Annual Report Download - page 72
Download and view the complete annual report
Please find page 72 of the 2012 Cigna annual report below. You can navigate through the pages in the report by either clicking on the pages listed below, or by using the keyword search tool below to find specific information within the annual report.-
 1
1 -
2
-
3
-
4
-
5
-
6
-
7
-
8
-
9
-
10
-
11
-
12
-
13
-
14
-
15
-
16
-
17
-
18
-
19
-
20
-
21
-
22
-
23
-
24
-
25
-
26
-
27
-
28
-
29
-
30
-
31
-
32
-
33
-
34
-
35
-
36
-
37
-
38
-
39
-
40
-
41
-
42
-
43
-
44
-
45
-
46
-
47
-
48
-
49
-
50
-
51
-
52
-
53
-
54
-
55
-
56
-
57
-
58
-
59
-
60
-
61
-
 62
62 -
 63
63 -
 64
64 -
 65
65 -
 66
66 -
 67
67 -
 68
68 -
 69
69 -
 70
70 -
 71
71 -
 72
72 -
 73
73 -
 74
74 -
 75
75 -
 76
76 -
 77
77 -
 78
78 -
 79
79 -
 80
80 -
 81
81 -
 82
82 -
83
-
84
-
85
-
86
-
87
-
88
-
89
-
90
-
91
-
92
-
93
-
94
-
95
-
96
-
97
-
98
-
99
-
100
-
101
-
102
-
103
-
104
-
105
-
106
-
107
-
108
-
109
-
110
-
111
-
112
-
113
-
114
-
115
-
116
-
117
-
118
-
119
-
120
-
121
-
122
-
123
-
124
-
125
-
126
-
127
-
128
-
129
-
130
-
131
-
132
-
133
-
134
-
135
-
136
-
137
-
138
-
139
-
140
-
141
-
142
-
143
-
144
-
145
-
146
-
147
-
148
-
149
-
150
-
151
-
152
-
153
-
154
-
155
-
156
-
157
-
158
-
159
-
160
-
161
-
162
-
163
-
164
-
165
-
166
-
167
-
168
-
169
-
170
-
171
-
172
-
173
-
174
-
175
-
176
-
177
-
178
-
179
-
180
-
181
-
182
 |
 |

PART II
ITEM 7 Management’s Discussion and Analysis of Financial Condition and Results of Operations
Other Operations Segment
Segment Description
Cigna’s Other Operations segment includes the results of the following businesses:
corporate-owned life insurance (‘‘COLI’’);
deferred gains recognized from the sale of the retirement benefits and individual life insurance and annuity businesses; and
run-off settlement annuity business.
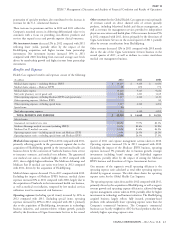
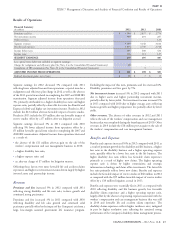
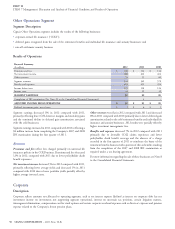
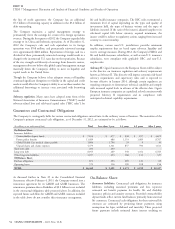
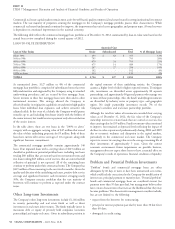
Results of Operations
Financial Summary
(In millions)
2012 2011 2010
Premiums and fees $ 100 $ 114 $ 114
Net investment income 388 400 404
Other revenues 55 55 60
Segment revenues 543 569 578
Benefits and expenses 418 451 454
Income before taxes 125 118 124
Income taxes 43 29 39
SEGMENT EARNINGS 82 89 85
Completion of IRS examination (See Note 20 to the Consolidated Financial Statements) - 4 -
ADJUSTED INCOME FROM OPERATIONS $ 82 $ 85 $ 85
Realized investment gains, net of taxes $ 2 $ 6 $ 5
Segment earnings decreased 8% in 2012 compared with 2011, Other revenues were flat in 2012 compared with 2011 and decreased
primarily reflecting lower COLI interest margins and mortality gains 8% in 2011 compared with 2010 primarily due to lower deferred gain
and the continued decline in deferred gain amortization associated amortization related to the sold retirement benefits and individual life
with the sold businesses. insurance and annuity businesses. 2012 results were partially offset by
higher investment management fees.
Segment earnings increased in 2011 compared with 2010, reflecting a
$4 million increase from completing the Company’s 2007 and 2008 Benefits and expenses decreased 7% in 2012 compared with 2011
IRS examination during the first quarter of 2011. primarily due to favorable COLI claims experience and lower
policyholder death benefit coverage and the absence of a charge
recorded in the first quarter of 2011 to reimburse the buyer of the
Revenues
retirement benefits business with a portion of the tax benefits resulting
from the completion of the 2007 and 2008 IRS examination as
Premiums and fees reflect fees charged primarily on universal life required under a tax sharing agreement.
insurance policies in the COLI business. Premiums and fees decreased
12% in 2012, compared with 2011 due to lower policyholder death For more information regarding the sale of these businesses see Note 8
benefit exposures. to the Consolidated Financial Statements.
Net investment income decreased 3% in 2012 compared with 2011,
primarily reflecting lower average yields and decreased 1% in 2011
compared with 2010 due to lower portfolio yields partially offset by
higher average invested assets.
Corporate
Description
Corporate reflects amounts not allocated to operating segments, such as net interest expense (defined as interest on corporate debt less net
investment income on investments not supporting segment operations), interest on uncertain tax positions, certain litigation matters,
intersegment eliminations, compensation cost for stock options and certain corporate overhead expenses such as directors’ expenses and pension
expense related to the Company’s frozen pension plans.
50 CIGNA CORPORATION - 2012 Form 10-K
•
•
•