Cigna 2012 Annual Report Download - page 74
Download and view the complete annual report
Please find page 74 of the 2012 Cigna annual report below. You can navigate through the pages in the report by either clicking on the pages listed below, or by using the keyword search tool below to find specific information within the annual report.-
 1
1 -
2
-
3
-
4
-
5
-
6
-
7
-
8
-
9
-
10
-
11
-
12
-
13
-
14
-
15
-
16
-
17
-
18
-
19
-
20
-
21
-
22
-
23
-
24
-
25
-
26
-
27
-
28
-
29
-
30
-
31
-
32
-
33
-
34
-
35
-
36
-
37
-
38
-
39
-
40
-
41
-
42
-
43
-
44
-
45
-
46
-
47
-
48
-
49
-
50
-
51
-
52
-
53
-
54
-
55
-
56
-
57
-
58
-
59
-
60
-
61
-
62
-
63
-
 64
64 -
 65
65 -
 66
66 -
 67
67 -
 68
68 -
 69
69 -
 70
70 -
 71
71 -
 72
72 -
 73
73 -
 74
74 -
 75
75 -
 76
76 -
 77
77 -
 78
78 -
 79
79 -
 80
80 -
 81
81 -
 82
82 -
 83
83 -
 84
84 -
85
-
86
-
87
-
88
-
89
-
90
-
91
-
92
-
93
-
94
-
95
-
96
-
97
-
98
-
99
-
100
-
101
-
102
-
103
-
104
-
105
-
106
-
107
-
108
-
109
-
110
-
111
-
112
-
113
-
114
-
115
-
116
-
117
-
118
-
119
-
120
-
121
-
122
-
123
-
124
-
125
-
126
-
127
-
128
-
129
-
130
-
131
-
132
-
133
-
134
-
135
-
136
-
137
-
138
-
139
-
140
-
141
-
142
-
143
-
144
-
145
-
146
-
147
-
148
-
149
-
150
-
151
-
152
-
153
-
154
-
155
-
156
-
157
-
158
-
159
-
160
-
161
-
162
-
163
-
164
-
165
-
166
-
167
-
168
-
169
-
170
-
171
-
172
-
173
-
174
-
175
-
176
-
177
-
178
-
179
-
180
-
181
-
182
 |
 |

PART II
ITEM 7 Management’s Discussion and Analysis of Financial Condition and Results of Operations
The Company prioritizes its use of capital resources to:
Capital Resources
provide capital necessary to support growth and maintain or
The Company’s capital resources (primarily retained earnings and the improve the financial strength ratings of its subsidiaries;
proceeds from the issuance of debt and equity securities) provide
protection for policyholders, furnish the financial strength to consider acquisitions that are strategically and economically
underwrite insurance risks and facilitate continued business growth. advantageous; and
Management, guided by regulatory requirements and rating agency return capital to investors through share repurchase.
capital guidelines, determines the amount of capital resources that the The availability of capital resources will be impacted by equity and
Company maintains. Management allocates resources to new credit market conditions. Extreme volatility in credit or equity market
long-term business commitments when returns, considering the risks, conditions may reduce the Company’s ability to issue debt or equity
look promising and when the resources available to support existing securities.
business are adequate.
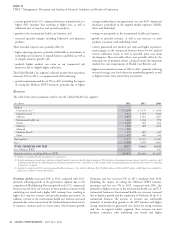
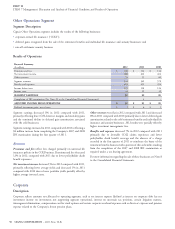
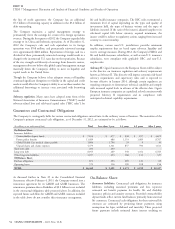
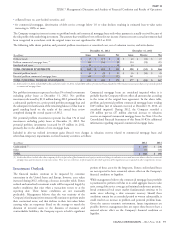
Cash flows for the years ended December 31, were as follows:
(In millions)
2012 2011 2010
Operating activities $ 2,350 $ 1,491 $ 1,743
Investing activities $ (3,857) $ (1,270) $ (1,342)
Financing activities $ (228) $ 2,867 $ 274
Cash flows from operating activities consist of cash receipts and
Investing activities
disbursements for premiums and fees, mail order pharmacy and other Cash used in investing activities was $3.9 billion in 2012, $3.6 billion
revenues, gains (losses) recognized in connection with the Company’s of which was for the acquisitions (net of cash acquired) of
GMDB and GMIB equity hedge programs, investment income, taxes, HealthSpring, Great American Supplemental Benefits, and the joint
and benefits and expenses. Because certain income and expense venture in Turkey. Cash used in investing activities also included net
transactions do not generate cash, and because cash transactions purchases of investments of $132 million and net purchases of
related to revenues and expenses may occur in periods different from property and equipment (primarily internal-use software) of
when those revenues and expenses are recognized in shareholders’ net $408 million.
income, cash flows from operating activities can be significantly
different from shareholders’ net income.
Financing activities
Cash flows from investing activities generally consist of net
investment purchases or sales and net purchases of property and Cash used in financing activities in 2012 primarily reflects the
equipment, that includes capitalized software, as well as cash used to repayment of debt assumed in the HealthSpring acquisition of
acquire businesses. $326 million and the repurchase of common stock for $208 million.
These effects were partially offset by the change in short-term debt of
Cash flows from financing activities are generally comprised of
$98 million primarily from the issuance of commercial paper,
issuances and re-payment of debt at the parent company level,
proceeds from the issuance of common stock from employee benefit
proceeds on the issuance of common stock resulting from stock
plans of $121 million and net deposits to contractholder deposit
option exercises, and stock repurchases. In addition, the subsidiaries
funds of $73 million.
report net deposits and withdrawals to or from investment contract
liabilities (that include universal life insurance liabilities) because such Share Repurchase. The Company maintains a share repurchase
liabilities are considered financing activities with policyholders. program, that was authorized by its Board of Directors. The decision
to repurchase shares depends on market conditions and alternate uses
of capital. The Company has, and may continue from time to time, to
2012:
repurchase shares on the open market through a Rule 10b5-1 plan
Operating activities
that permits a company to repurchase its shares at times when it
otherwise might be precluded from doing so under insider trading
Cash flows from operating activities increased by $859 million in laws or because of self-imposed trading blackout periods. The
2012 compared with 2011, primarily the result of strong earnings Company suspends activity under this program from time to time and
growth in the ongoing business segments in 2012. In addition, 2011 also removes such suspensions, generally without public
operating cash flows were adversely affected by significant claim announcement.
run-out from the Medicare IPFFS business that the Company exited
in 2011. In 2012 the Company repurchased 4.4 million shares for
$208 million. On February 27, 2013, the Company’s Board of
Directors increased share repurchase authority by $500 million.
Accordingly, the total remaining share repurchase authorization as of
February 28, 2013 was $815 million. In 2011 the Company
52 CIGNA CORPORATION - 2012 Form 10-K
•
•
•