Cigna 2012 Annual Report Download - page 69
Download and view the complete annual report
Please find page 69 of the 2012 Cigna annual report below. You can navigate through the pages in the report by either clicking on the pages listed below, or by using the keyword search tool below to find specific information within the annual report.-
 1
1 -
2
-
3
-
4
-
5
-
6
-
7
-
8
-
9
-
10
-
11
-
12
-
13
-
14
-
15
-
16
-
17
-
18
-
19
-
20
-
21
-
22
-
23
-
24
-
25
-
26
-
27
-
28
-
29
-
30
-
31
-
32
-
33
-
34
-
35
-
36
-
37
-
38
-
39
-
40
-
41
-
42
-
43
-
44
-
45
-
46
-
47
-
48
-
49
-
50
-
51
-
52
-
53
-
54
-
55
-
56
-
57
-
58
-
 59
59 -
 60
60 -
 61
61 -
 62
62 -
 63
63 -
 64
64 -
 65
65 -
 66
66 -
 67
67 -
 68
68 -
 69
69 -
 70
70 -
 71
71 -
 72
72 -
 73
73 -
 74
74 -
 75
75 -
 76
76 -
 77
77 -
 78
78 -
 79
79 -
80
-
81
-
82
-
83
-
84
-
85
-
86
-
87
-
88
-
89
-
90
-
91
-
92
-
93
-
94
-
95
-
96
-
97
-
98
-
99
-
100
-
101
-
102
-
103
-
104
-
105
-
106
-
107
-
108
-
109
-
110
-
111
-
112
-
113
-
114
-
115
-
116
-
117
-
118
-
119
-
120
-
121
-
122
-
123
-
124
-
125
-
126
-
127
-
128
-
129
-
130
-
131
-
132
-
133
-
134
-
135
-
136
-
137
-
138
-
139
-
140
-
141
-
142
-
143
-
144
-
145
-
146
-
147
-
148
-
149
-
150
-
151
-
152
-
153
-
154
-
155
-
156
-
157
-
158
-
159
-
160
-
161
-
162
-
163
-
164
-
165
-
166
-
167
-
168
-
169
-
170
-
171
-
172
-
173
-
174
-
175
-
176
-
177
-
178
-
179
-
180
-
181
-
182
 |
 |
PART II
ITEM 7 Management’s Discussion and Analysis of Financial Condition and Results of Operations
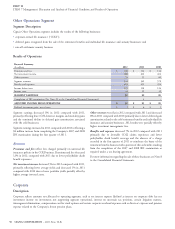
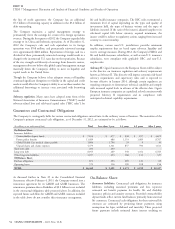
Supplemental Benefits segment’s adjusted income from operations activities in certain markets. Policy acquisition expenses increased in
increased 2% in 2011 compared with 2010. The increases in both 2011 compared with 2010 reflecting business growth and foreign
segment earnings and adjusted income from operations were currency movements.
primarily due to revenue growth and higher persistency, particularly Excluding the special items (presented in the table above), expense
in South Korea, and higher net investment income, substantially ratios increased for 2012 compared to 2011. This increase was
offset by higher policy acquisition costs and expense ratios, as well as, primarily driven by the impact of the higher expense ratios associated
by a higher effective tax rate primarily due to unfavorable changes in with FirstAssist. Excluding the special items (presented in the table
foreign tax law. above), expense ratios increased in 2011 compared with 2010,
The unfavorable impacts of foreign currency movements in 2012 primarily due to strategic investments for future growth and costs to
using 2011 rates, as well as the favorable impacts in 2011 using 2010 streamline operations, partially offset by higher revenues in South
rates, primarily reflects the movement between the U.S. dollar and the Korea.
South Korean won.
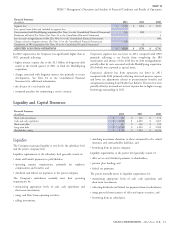
Other Items Affecting Global Supplemental Benefits
Revenues
Results
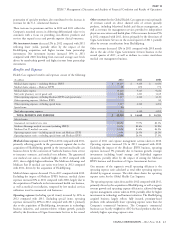
Premiums and fees. Excluding the effect of foreign currency For the Company’s Global Supplemental Benefits segment, South
movements, premiums and fees increased by 32% in 2012, compared Korea is the single largest geographic market, generating 54% of the
with 2011. These increases are primarily attributable to the higher segment’s revenues and 90% of earnings in 2012. Due to the
revenue associated with the acquisitions of FirstAssist and Great concentration of business in South Korea, the Global Supplemental
American Supplemental Benefits (the acquisitions), strong Benefits segment is exposed to potential losses resulting from
persistency, and new sales growth, particularly in South Korea. economic, regulatory and geopolitical developments in that country,
as well as foreign currency movements affecting the South Korean
Excluding the effect of foreign currency movements, premiums and currency, that could have a significant impact on the segment’s results
fees were $1.5 billion in 2011 compared with reported premiums and and the Company’s consolidated financial results.
fees of $1.2 billion in 2010, an increase of 19%. The increase is
primarily attributable to new sales growth, particularly in South Korea
and Taiwan.
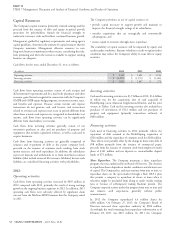
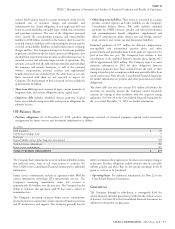
Run-off Reinsurance Segment
Net investment income increased by 8% in 2012, compared with
Segment Description
2011, and 20% in 2011, compared with 2010. These increases were
The Company’s reinsurance operations were discontinued and are
primarily due to asset growth in South Korea.
now an inactive business in run-off mode since the sale of the U.S.
individual life, group life and accidental death reinsurance business in
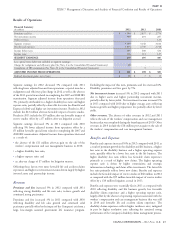
Benefits and Expenses
2000. In 2010, the Company essentially exited from its workers’
compensation and personal accident reinsurance business by
Excluding the impact of foreign currency movements, benefits and purchasing retrocessional coverage from a Bermuda subsidiary of
expenses were $1.9 billion in 2012, compared to reported benefits and Enstar Group Limited. This segment is predominantly comprised of
expenses of $1.5 billion in 2011, an increase of 30%. These increases guaranteed minimum death benefit (‘‘GMDB’’, also known as
were primarily due to the acquisitions and business growth. ‘‘VADBe’’) and guaranteed minimum income benefit (‘‘GMIB’’)
Excluding the impact of foreign currency movements, benefits and products.
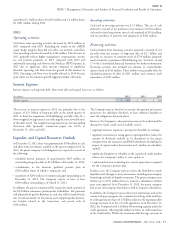
expenses were $1.4 billion in 2011, compared with reported benefits Effective February 4, 2013, the Company reinsured 100% of the
and expenses of $1.2 billion in 2010, an increase of 20%. The increase Company’s future exposures for the Run-off GMDB and GMIB
was primarily due to business growth. businesses, net of retrocessional arrangements in place prior to
Loss ratios increased slightly in 2012, reflecting the inherently higher February 4, 2013, up to a specified limit. See Note 25 to the
loss ratios of the acquisitions. Loss ratios were flat in 2011 compared Consolidated Financial Statements for additional information. The
with 2010. Company describes the assumptions used to develop the reserves for
GMDB in Note 7 to the Consolidated Financial Statements and for
Policy acquisition expenses increased in 2012 compared with 2011 the assets and liabilities associated with GMIB in Note 11 to the
reflecting the acquisitions and business growth, partially offset by Consolidated Financial Statements.
lower acquisition costs in Europe reflecting a decision to cease selling
CIGNA CORPORATION - 2012 Form 10-K 47