Cigna 2012 Annual Report Download - page 149
Download and view the complete annual report
Please find page 149 of the 2012 Cigna annual report below. You can navigate through the pages in the report by either clicking on the pages listed below, or by using the keyword search tool below to find specific information within the annual report.-
 1
1 -
2
-
3
-
4
-
5
-
6
-
7
-
8
-
9
-
10
-
11
-
12
-
13
-
14
-
15
-
16
-
17
-
18
-
19
-
20
-
21
-
22
-
23
-
24
-
25
-
26
-
27
-
28
-
29
-
30
-
31
-
32
-
33
-
34
-
35
-
36
-
37
-
38
-
39
-
40
-
41
-
42
-
43
-
44
-
45
-
46
-
47
-
48
-
49
-
50
-
51
-
52
-
53
-
54
-
55
-
56
-
57
-
58
-
59
-
60
-
61
-
62
-
63
-
64
-
65
-
66
-
67
-
68
-
69
-
70
-
71
-
72
-
73
-
74
-
75
-
76
-
77
-
78
-
79
-
80
-
81
-
82
-
83
-
84
-
85
-
86
-
87
-
88
-
89
-
90
-
91
-
92
-
93
-
94
-
95
-
96
-
97
-
98
-
99
-
100
-
101
-
102
-
103
-
104
-
105
-
106
-
107
-
108
-
109
-
110
-
111
-
112
-
113
-
114
-
115
-
116
-
117
-
118
-
119
-
120
-
121
-
122
-
123
-
124
-
125
-
126
-
127
-
128
-
129
-
130
-
131
-
132
-
133
-
134
-
135
-
136
-
137
-
138
-
 139
139 -
 140
140 -
 141
141 -
 142
142 -
 143
143 -
 144
144 -
 145
145 -
 146
146 -
 147
147 -
 148
148 -
 149
149 -
 150
150 -
 151
151 -
 152
152 -
 153
153 -
 154
154 -
 155
155 -
 156
156 -
 157
157 -
 158
158 -
 159
159 -
160
-
161
-
162
-
163
-
164
-
165
-
166
-
167
-
168
-
169
-
170
-
171
-
172
-
173
-
174
-
175
-
176
-
177
-
178
-
179
-
180
-
181
-
182
 |
 |

PART II
ITEM 8 Financial Statements and Supplementary Data
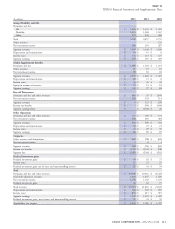
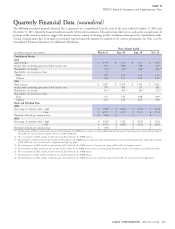
Quarterly Financial Data (unaudited)
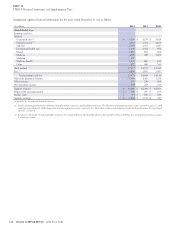
The following unaudited quarterly financial data is presented on a consolidated basis for each of the years ended December 31, 2012 and
December 31, 2011. Quarterly financial results necessarily rely heavily on estimates. This and certain other factors, such as the seasonal nature of
portions of the insurance business, suggest the need to exercise caution in drawing specific conclusions from quarterly consolidated results.
Certain reclassifications have been made to previously reported quarterly amounts to conform to the current presentation. See Note 2 to the
Consolidated Financial Statements for additional information.
Three Months Ended
(In millions, except per share amounts)
March 31 June 30 Sept. 30 Dec. 31
Consolidated Results
2012
Total revenues $ 6,754 $ 7,422 $ 7,323 $ 7,620
Income from continuing operations before income taxes 552 588 718 619
Shareholders’ net income 371
(1)
380
(2)
466
(3)
406
(4)
Shareholders’ net income per share: 1
Basic 1.30 1.33 1.64 1.43
Diluted 1.28 1.31 1.61 1.41
2011
Total revenues $ 5,387 $ 5,479 $ 5,574 $ 5,425
Income from continuing operations before income taxes 579 592 273 432
Shareholders’ net income 413
(5)
391
(6)
183
(7)
273
(8)
Shareholders’ net income per share:
Basic 1.53 1.46 0.68 0.99
Diluted 1.51 1.43 0.67 0.98
Stock and Dividend Data
2012
Price range of common stock – high $ 49.89 $ 49.63 $ 47.92 $ 54.53
– low $ 41.27 $ 42.21 $ 39.34 $ 47.31
Dividends declared per common share $ 0.04 $ - $ - $ -
2011
Price range of common stock – high $ 44.29 $ 51.81 $ 52.95 $ 47.61
– low $ 36.76 $ 42.80 $ 40.24 $ 38.82
Dividends declared per common share $ 0.04 $ - $ - $ -
(1) The first quarter of 2012 includes an after-tax gain of $41 million for the GMIB business, an after-tax charge of $28 million for costs associated with acquisitions, and an after-tax charge of
$13 million for costs associated a litigation matter in Global Health Care.
(2) The second quarter of 2012 includes an after-tax loss of $51 million for the GMIB business.
(3) The third quarter of 2012 includes an after-tax gain of $32 million for the GMIB business, an after-tax charge of $12 million for costs associated with acquisitions, and an after-tax charge
of $50 million for costs associated with a realignment and efficiency plan.
(4) The fourth quarter of 2012 includes an after-tax gain of $7 million for the GMIB business and an after-tax charge of $68 million for litigation matters.
(5) The first quarter of 2011 includes an after-tax gain of $13 million for the GMIB business and a net tax benefit of $24 million related to the resolution of a Federal tax matter.
(6) The second quarter of 2011 includes an after-tax loss of $21 million for the GMIB business.
(7) The third quarter of 2011 includes an after-tax loss of $134 million for the GMIB business.
(8) The fourth quarter of 2011 includes an after-tax gain of $7 million for the GMIB business and, an after-tax charge of $31 million for costs associated with acquisitions.
CIGNA CORPORATION - 2012 Form 10-K 127