Cigna 2012 Annual Report Download - page 53
Download and view the complete annual report
Please find page 53 of the 2012 Cigna annual report below. You can navigate through the pages in the report by either clicking on the pages listed below, or by using the keyword search tool below to find specific information within the annual report.-
 1
1 -
2
-
3
-
4
-
5
-
6
-
7
-
8
-
9
-
10
-
11
-
12
-
13
-
14
-
15
-
16
-
17
-
18
-
19
-
20
-
21
-
22
-
23
-
24
-
25
-
26
-
27
-
28
-
29
-
30
-
31
-
32
-
33
-
34
-
35
-
36
-
37
-
38
-
39
-
40
-
41
-
42
-
 43
43 -
 44
44 -
 45
45 -
 46
46 -
 47
47 -
 48
48 -
 49
49 -
 50
50 -
 51
51 -
 52
52 -
 53
53 -
 54
54 -
 55
55 -
 56
56 -
 57
57 -
 58
58 -
 59
59 -
 60
60 -
 61
61 -
 62
62 -
 63
63 -
64
-
65
-
66
-
67
-
68
-
69
-
70
-
71
-
72
-
73
-
74
-
75
-
76
-
77
-
78
-
79
-
80
-
81
-
82
-
83
-
84
-
85
-
86
-
87
-
88
-
89
-
90
-
91
-
92
-
93
-
94
-
95
-
96
-
97
-
98
-
99
-
100
-
101
-
102
-
103
-
104
-
105
-
106
-
107
-
108
-
109
-
110
-
111
-
112
-
113
-
114
-
115
-
116
-
117
-
118
-
119
-
120
-
121
-
122
-
123
-
124
-
125
-
126
-
127
-
128
-
129
-
130
-
131
-
132
-
133
-
134
-
135
-
136
-
137
-
138
-
139
-
140
-
141
-
142
-
143
-
144
-
145
-
146
-
147
-
148
-
149
-
150
-
151
-
152
-
153
-
154
-
155
-
156
-
157
-
158
-
159
-
160
-
161
-
162
-
163
-
164
-
165
-
166
-
167
-
168
-
169
-
170
-
171
-
172
-
173
-
174
-
175
-
176
-
177
-
178
-
179
-
180
-
181
-
182
 |
 |

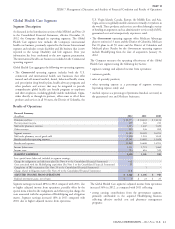
PART II
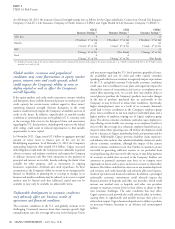
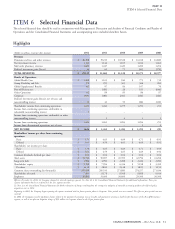
ITEM 6 Selected Financial Data
Selected Financial Data
The selected financial data should be read in conjunction with Management’s Discussion and Analysis of Financial Condition and Results of
Operations and the Consolidated Financial Statements and accompanying notes included elsewhere herein.
Highlights
(Dollars in millions, except per share amounts)
2012 2011 2010 2009 2008
Revenues
Premiums and fees and other revenues $ 26,308 $ 19,210 $ 18,528 $ 16,018 $ 16,880
Net investment income 1,144 1,146 1,105 1,014 1,063
Mail order pharmacy revenues 1,623 1,447 1,420 1,282 1,204
Realized investment gains (losses) 44 62 75 (43) (170)
TOTAL REVENUES $ 29,119 $ 21,865 $ 21,128 $ 18,271 $ 18,977
Results of Operations:
Global Health Care $ 1,418 $ 1,105 $ 940 $ 775 $ 732
Group Disability and Life 279 295 305 306 282
Global Supplemental Benefits 142 97 84 107 70
Run-off Reinsurance – (183) 26 185 (646)
Other Operations 82 89 85 86 87
Corporate (329) (184) (211) (142) (162)
Realized investment gains (losses), net of taxes and
noncontrolling interest 31 41 50 (26) (110)
Shareholders’ income from continuing operations 1,623 1,260 1,279 1,291 253
Income from continuing operations attributable to
redeemable noncontrolling interest 1––––
Income from continuing operations attributable to other
noncontrolling interest –1432
Income from continuing operations 1,624 1,261 1,283 1,294 255
Income from discontinued operations, net of taxes –––14
NET INCOME $ 1,624 $ 1,261 $ 1,283 $ 1,295 $ 259
Shareholders’ income per share from continuing
operations:
Basic $ 5.70 $ 4.65 $ 4.69 $ 4.71 $ 0.91
Diluted $ 5.61 $ 4.59 $ 4.65 $ 4.69 $ 0.91
Shareholders’ net income per share:
Basic $ 5.70 $ 4.65 $ 4.69 $ 4.71 $ 0.93
Diluted $ 5.61 $ 4.59 $ 4.65 $ 4.69 $ 0.92
Common dividends declared per share $ 0.04 $ 0.04 $ 0.04 $ 0.04 $ 0.04
Total assets $ 53,734 $ 50,697 $ 45,393 $ 42,794 $ 41,206
Long-term debt $ 4,986 $ 4,990 $ 2,288 $ 2,436 $ 2,090
Shareholders’ equity $ 9,769 $ 7,994 $ 6,356 $ 5,198 $ 3,392
Per share $ 34.18 $ 28.00 $ 23.38 $ 18.95 $ 12.51
Common shares outstanding (in thousands) 285,829 285,533 271,880 274,257 271,036
Shareholders of record 7,885 8,178 8,568 8,888 9,014
Employees 35,800 31,400 30,600 29,300 30,300
Effective December 31, 2012, the Company changed its external reporting segments. See Note 23 to the Consolidated Financial Statements for additional information. Prior year
segment information has been conformed to the new segment structure.
See Note 2 to the Consolidated Financial Statements for further discussion of changes resulting from the retrospective adoption of amended accounting guidance for deferred policy
acquisition costs in 2012.
Beginning in 2010, the Company began reporting the expense associated with its frozen pension plans in Corporate. Prior periods were not restated. The effect on prior periods was not
material.
In 2008, the Company recorded significant charges related to the guaranteed minimum income benefits and guaranteed minimum death benefits businesses of the Run-off Reinsurance
segment, as well as an after-tax litigation charge of $52 million in Corporate related to the Cigna pension plan.
CIGNA CORPORATION - 2012 Form 10-K 31
ITEM 6