Cigna 2012 Annual Report Download - page 124
Download and view the complete annual report
Please find page 124 of the 2012 Cigna annual report below. You can navigate through the pages in the report by either clicking on the pages listed below, or by using the keyword search tool below to find specific information within the annual report.-
 1
1 -
2
-
3
-
4
-
5
-
6
-
7
-
8
-
9
-
10
-
11
-
12
-
13
-
14
-
15
-
16
-
17
-
18
-
19
-
20
-
21
-
22
-
23
-
24
-
25
-
26
-
27
-
28
-
29
-
30
-
31
-
32
-
33
-
34
-
35
-
36
-
37
-
38
-
39
-
40
-
41
-
42
-
43
-
44
-
45
-
46
-
47
-
48
-
49
-
50
-
51
-
52
-
53
-
54
-
55
-
56
-
57
-
58
-
59
-
60
-
61
-
62
-
63
-
64
-
65
-
66
-
67
-
68
-
69
-
70
-
71
-
72
-
73
-
74
-
75
-
76
-
77
-
78
-
79
-
80
-
81
-
82
-
83
-
84
-
85
-
86
-
87
-
88
-
89
-
90
-
91
-
92
-
93
-
94
-
95
-
96
-
97
-
98
-
99
-
100
-
101
-
102
-
103
-
104
-
105
-
106
-
107
-
108
-
109
-
110
-
111
-
112
-
113
-
 114
114 -
 115
115 -
 116
116 -
 117
117 -
 118
118 -
 119
119 -
 120
120 -
 121
121 -
 122
122 -
 123
123 -
 124
124 -
 125
125 -
 126
126 -
 127
127 -
 128
128 -
 129
129 -
 130
130 -
 131
131 -
 132
132 -
 133
133 -
 134
134 -
135
-
136
-
137
-
138
-
139
-
140
-
141
-
142
-
143
-
144
-
145
-
146
-
147
-
148
-
149
-
150
-
151
-
152
-
153
-
154
-
155
-
156
-
157
-
158
-
159
-
160
-
161
-
162
-
163
-
164
-
165
-
166
-
167
-
168
-
169
-
170
-
171
-
172
-
173
-
174
-
175
-
176
-
177
-
178
-
179
-
180
-
181
-
182
 |
 |

PART II
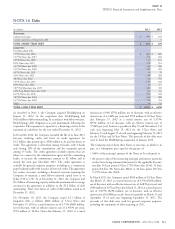
ITEM 8 Financial Statements and Supplementary Data
December 31, 2011
Amortized Unrealized Unrealized Fair
(In millions)
Cost Appreciation Depreciation Value
Federal government and agency $ 552 $ 406 $ - $ 958
State and local government 2,185 274 (3) 2,456
Foreign government 1,173 103 (2) 1,274
Corporate 9,460 1,070 (45) 10,485
Federal agency mortgage-backed 9 - - 9
Other mortgage-backed 73 10 (4) 79
Other asset-backed 777 160 (11) 926
TOTAL $ 14,229 $ 2,023 $ (65) $ 16,187
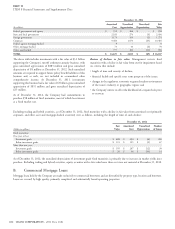
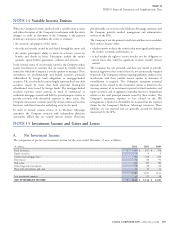
The above table includes investments with a fair value of $3.1 billion Review of declines in fair value. Management reviews fixed
supporting the Company’s run-off settlement annuity business, with maturities with a decline in fair value from cost for impairment based
gross unrealized appreciation of $883 million and gross unrealized on criteria that include:
depreciation of $8 million at December 31, 2012. Such unrealized length of time and severity of decline;
amounts are required to support future policy benefit liabilities of this
business and, as such, are not included in accumulated other financial health and specific near term prospects of the issuer;
comprehensive income. At December 31, 2011, investments changes in the regulatory, economic or general market environment
supporting this business had a fair value of $3 billion, gross unrealized of the issuer’s industry or geographic region; and
appreciation of $851 million and gross unrealized depreciation of
$25 million. the Company’s intent to sell or the likelihood of a required sale prior
to recovery.
As of December 31, 2012, the Company had commitments to
purchase $58 million of fixed maturities, most of which bear interest
at a fixed market rate.
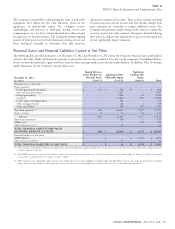
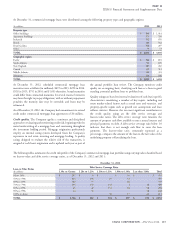
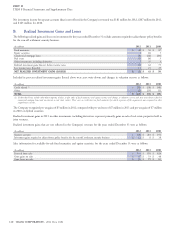
Excluding trading and hybrid securities, as of December 31, 2012, fixed maturities with a decline in fair value from amortized cost (primarily
corporate, and other asset and mortgage-backed securities) were as follows, including the length of time of such decline:
December 31, 2012
Fair Amortized Unrealized Number
(Dollars in millions)
Value Cost Depreciation of Issues
Fixed maturities:
One year or less:
Investment grade $ 488 $ 494 $ (6) 200
Below investment grade $ 123 $ 125 $ (2) 67
More than one year:
Investment grade $ 195 $ 207 $ (12) 39
Below investment grade $ 26 $ 36 $ (10) 14
As of December 31, 2012, the unrealized depreciation of investment grade fixed maturities is primarily due to increases in market yields since
purchase. Excluding trading and hybrid securities, equity securities with a fair value lower than cost were not material at December 31, 2012.
B. Commercial Mortgage Loans
Mortgage loans held by the Company are made exclusively to commercial borrowers and are diversified by property type, location and borrower.
Loans are secured by high quality, primarily completed and substantially leased operating properties.
102 CIGNA CORPORATION - 2012 Form 10-K
•
•
•
•