Cigna 2012 Annual Report Download - page 139
Download and view the complete annual report
Please find page 139 of the 2012 Cigna annual report below. You can navigate through the pages in the report by either clicking on the pages listed below, or by using the keyword search tool below to find specific information within the annual report.-
 1
1 -
2
-
3
-
4
-
5
-
6
-
7
-
8
-
9
-
10
-
11
-
12
-
13
-
14
-
15
-
16
-
17
-
18
-
19
-
20
-
21
-
22
-
23
-
24
-
25
-
26
-
27
-
28
-
29
-
30
-
31
-
32
-
33
-
34
-
35
-
36
-
37
-
38
-
39
-
40
-
41
-
42
-
43
-
44
-
45
-
46
-
47
-
48
-
49
-
50
-
51
-
52
-
53
-
54
-
55
-
56
-
57
-
58
-
59
-
60
-
61
-
62
-
63
-
64
-
65
-
66
-
67
-
68
-
69
-
70
-
71
-
72
-
73
-
74
-
75
-
76
-
77
-
78
-
79
-
80
-
81
-
82
-
83
-
84
-
85
-
86
-
87
-
88
-
89
-
90
-
91
-
92
-
93
-
94
-
95
-
96
-
97
-
98
-
99
-
100
-
101
-
102
-
103
-
104
-
105
-
106
-
107
-
108
-
109
-
110
-
111
-
112
-
113
-
114
-
115
-
116
-
117
-
118
-
119
-
120
-
121
-
122
-
123
-
124
-
125
-
126
-
127
-
128
-
 129
129 -
 130
130 -
 131
131 -
 132
132 -
 133
133 -
 134
134 -
 135
135 -
 136
136 -
 137
137 -
 138
138 -
 139
139 -
 140
140 -
 141
141 -
 142
142 -
 143
143 -
 144
144 -
 145
145 -
 146
146 -
 147
147 -
 148
148 -
 149
149 -
150
-
151
-
152
-
153
-
154
-
155
-
156
-
157
-
158
-
159
-
160
-
161
-
162
-
163
-
164
-
165
-
166
-
167
-
168
-
169
-
170
-
171
-
172
-
173
-
174
-
175
-
176
-
177
-
178
-
179
-
180
-
181
-
182
 |
 |

PART II
ITEM 8 Financial Statements and Supplementary Data
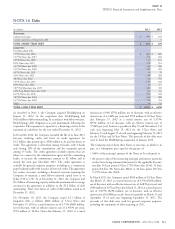
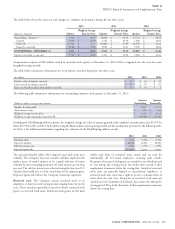
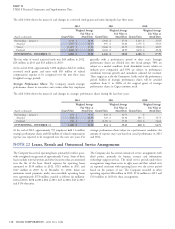
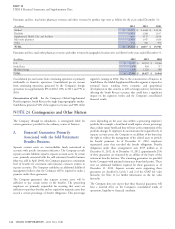
The table below shows the status of, and changes in, common stock options during the last three years:
2012 2011 2010
Weighted Average Weighted Average Weighted Average
(Options in thousands)
Options Exercise Price Options Exercise Price Options Exercise Price
Outstanding – January 1 9,581 $ 33.92 12,093 $ 31.10 13,751 $ 29.34
Granted 3,446 $ 28.29 1,546 $ 42.36 1,846 $ 34.64
Exercised (3,740) $ 22.72 (3,480) $ 27.93 (2,565) $ 24.31
Expired or canceled (336) $ 37.85 (578) $ 33.61 (939) $ 30.86
OUTSTANDING – DECEMBER 31 8,951 $ 36.29 9,581 $ 33.92 12,093 $ 31.10
Options exercisable at year-end 5,731 $ 34.93 6,147 $ 34.94 7,656 $ 34.42
Compensation expense of $20 million related to unvested stock options at December 31, 2012 will be recognized over the next two years
(weighted average period).
The table below summarizes information for stock options exercised during the last three years:
(In millions)
2012 2011 2010
Intrinsic value of options exercised $95 $53 $30
Cash received for options exercised $85 $97 $62
Excess tax benefits realized from options exercised $ 15 $ 10 $ 5
The following table summarizes information for outstanding common stock options at December 31, 2012:
Options Options
(Dollars in millions, except per share amounts)
Outstanding Exercisable
Number (in thousands) 8,951 5,731
Total intrinsic value $ 154 $ 106
Weighted average exercise price $ 36.29 $ 34.93
Weighted average remaining contractual life 6.3 yrs 5.1 yrs
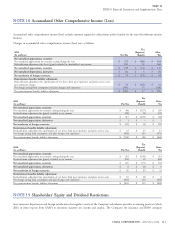
Excluding the HealthSpring rollover options, the weighted average fair value of options granted under employee incentive plans was $14.99 for
2012, $13.96 for 2011 and $11.56 for 2010, using the Black-Scholes option-pricing model and the assumptions presented in the following table.
See Note 3 for additional information regarding the valuation of the HealthSpring rollover awards.
2012 2011 2010
Dividend yield 0.1% 0.1% 0.1%
Expected volatility 40.0% 40.0% 40.0%
Risk-free interest rate 0.8% 1.7% 1.9%
Expected option life 4.5 years 4 years 4 years
The expected volatility reflects the Company’s past daily stock price widely used form of restricted stock awards and are used for
volatility. The Company does not consider volatility implied in the substantially all U.S.-based employees receiving such awards.
market prices of traded options to be a good indicator of future Recipients of restricted stock grants are entitled to earn dividends and
volatility because remaining maturities of traded options are less than to vote during the vesting period, but forfeit their awards if their
one year. The risk-free interest rate is derived using the four-year U.S. employment terminates before the vesting date. Awards of restricted
Treasury bond yield rate as of the award date for the primary grant. stock units are generally limited to international employees. A
Expected option life reflects the Company’s historical experience. restricted stock unit represents a right to receive a common share of
stock when the unit vests. Recipients of restricted stock units are
Restricted stock. The Company awards restricted stock to its entitled to receive hypothetical dividends, but cannot vote during the
employees or directors with vesting periods ranging from two to five vesting period. They forfeit their units if their employment terminates
years. These awards are generally in one of two forms: restricted stock before the vesting date.
grants or restricted stock units. Restricted stock grants are the most
CIGNA CORPORATION - 2012 Form 10-K 117