Cigna 2012 Annual Report Download - page 120
Download and view the complete annual report
Please find page 120 of the 2012 Cigna annual report below. You can navigate through the pages in the report by either clicking on the pages listed below, or by using the keyword search tool below to find specific information within the annual report.-
 1
1 -
2
-
3
-
4
-
5
-
6
-
7
-
8
-
9
-
10
-
11
-
12
-
13
-
14
-
15
-
16
-
17
-
18
-
19
-
20
-
21
-
22
-
23
-
24
-
25
-
26
-
27
-
28
-
29
-
30
-
31
-
32
-
33
-
34
-
35
-
36
-
37
-
38
-
39
-
40
-
41
-
42
-
43
-
44
-
45
-
46
-
47
-
48
-
49
-
50
-
51
-
52
-
53
-
54
-
55
-
56
-
57
-
58
-
59
-
60
-
61
-
62
-
63
-
64
-
65
-
66
-
67
-
68
-
69
-
70
-
71
-
72
-
73
-
74
-
75
-
76
-
77
-
78
-
79
-
80
-
81
-
82
-
83
-
84
-
85
-
86
-
87
-
88
-
89
-
90
-
91
-
92
-
93
-
94
-
95
-
96
-
97
-
98
-
99
-
100
-
101
-
102
-
103
-
104
-
105
-
106
-
107
-
108
-
109
-
 110
110 -
 111
111 -
 112
112 -
 113
113 -
 114
114 -
 115
115 -
 116
116 -
 117
117 -
 118
118 -
 119
119 -
 120
120 -
 121
121 -
 122
122 -
 123
123 -
 124
124 -
 125
125 -
 126
126 -
 127
127 -
 128
128 -
 129
129 -
 130
130 -
131
-
132
-
133
-
134
-
135
-
136
-
137
-
138
-
139
-
140
-
141
-
142
-
143
-
144
-
145
-
146
-
147
-
148
-
149
-
150
-
151
-
152
-
153
-
154
-
155
-
156
-
157
-
158
-
159
-
160
-
161
-
162
-
163
-
164
-
165
-
166
-
167
-
168
-
169
-
170
-
171
-
172
-
173
-
174
-
175
-
176
-
177
-
178
-
179
-
180
-
181
-
182
 |
 |

PART II
ITEM 8 Financial Statements and Supplementary Data
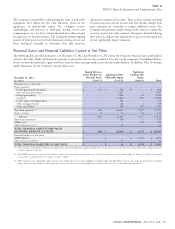
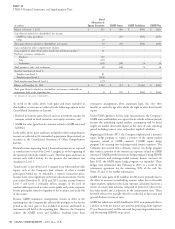
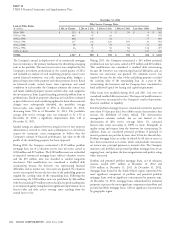
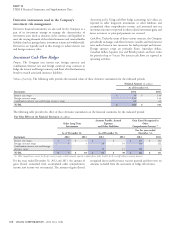
Fixed
Maturities &
(In millions)
Equity Securities GMIB Assets GMIB Liabilities GMIB Net
Balance at January 1, 2011 $ 933 $ 480 $ (903) $ (423)
Gains (losses) included in shareholders’ net income:
GMIB fair value gain/(loss) - 270 (504) (234)
Other 10 - - -
Total gains (losses) included in shareholders’ net income 10 270 (504) (234)
Gains included in other comprehensive income 7 - - -
Gains required to adjust future policy benefits for settlement annuities
(1)
41 - - -
Purchases, issuances, settlements:
Purchases 129 - - -
Sales (20) - - -
Settlements (61) (38) 74 36
Total purchases, sales, and settlements 48 (38) 74 36
Transfers into/(out of ) Level 3:
Transfers into Level 3 81 - - -
Transfers out of Level 3 (118) - - -
Total transfers into/(out of ) Level 3 (37) - - -
Balance at December 31, 2011 $ 1,002 $ 712 $ (1,333) $ (621)
Total gains (losses) included in shareholders’ net income attributable to
instruments held at the reporting date $ 6 $ 270 $ (504) $ (234)
(1) Amounts do not accrue to shareholders.
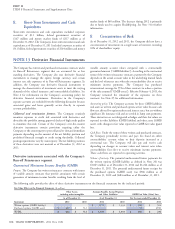
As noted in the tables above, total gains and losses included in reinsurance arrangements when annuitants lapse, die, elect their
shareholders’ net income are reflected in the following captions in the benefit, or reach the age after which the right to elect their benefit
Consolidated Statements of Income: expires.
Realized investment gains (losses) and net investment income for Under FASB’s guidance for fair value measurements, the Company’s
amounts related to fixed maturities and equity securities; and GMIB assets and liabilities are expected to be volatile in future periods
because the underlying capital markets assumptions will be based
GMIB fair value (gain) loss for amounts related to GMIB assets and largely on market observable inputs at the close of each reporting
liabilities. period including interest rates and market implied volatilities.
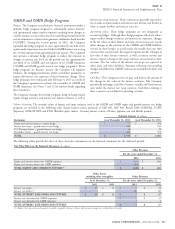
In the tables above, gains and losses included in other comprehensive Beginning in February 2011, the Company implemented a dynamic
income are reflected in Net unrealized appreciation (depreciation) on equity hedge program to reduce a portion of the equity market
securities in the Consolidated Statements of Other Comprehensive exposures related to GMIB contracts (‘‘GMIB equity hedge
Income. program’’) by entering into exchange-traded futures contracts. The
Company also entered into a dynamic interest rate hedge program
Reclassifications impacting Level 3 financial instruments are reported
that reduces a portion of the interest rate exposure related to GMIB
as transfers into or out of the Level 3 category as of the beginning of
contracts (‘‘GMIB growth interest rate hedge program’’) using LIBOR
the quarter in which the transfer occurs. Therefore gains and losses in
swap contracts and exchange-traded treasury futures contracts. In
income only reflect activity for the quarters the instrument was
June 2012, the GMIB equity hedge program was expanded. These
classified in Level 3.
hedges were terminated after February 4, 2013 as a result of the
Transfers into or out of the Level 3 category occur when unobservable reinsurance agreement for the remaining 45% of the risk. See
inputs, such as the Company’s best estimate of what a market Notes 25 and 13 for further information.
participant would use to determine a current transaction price,
GMIB fair value gains of $41 million for 2012 were primarily due to
become more or less significant to the fair value measurement. For the
the effect of increases in underlying account values due to favorable
years ended December 31, 2012 and 2011, transfer activity between
equity markets, updates in the claim exposure calculation based on a
Level 3 and Level 2 primarily reflects changes in the level of
review of actual claim amounts compared to projected values in the
unobservable inputs used to value certain public and private corporate
fair value model and a reduction in the annuitization rates. These
bonds, principally related to liquidity of the securities and credit risk
favorable effects were partially offset by a reduction in lapse rates and
of the issuers.
general declines in interest rates.
Because GMIB reinsurance arrangements remain in effect at the
GMIB fair value losses of $234 million for 2011 were primarily due to
reporting date, the Company has reflected the total gain or loss for the
a decline in both the interest rate used for projecting claim exposure
period as the total gain or loss included in income attributable to
(7-year Treasury rates) and the rate used for projecting market returns
instruments still held at the reporting date. However, the Company
and discounting (LIBOR swap curve).
reduces the GMIB assets and liabilities resulting from these
98 CIGNA CORPORATION - 2012 Form 10-K
•
•