Cigna 2012 Annual Report Download - page 67
Download and view the complete annual report
Please find page 67 of the 2012 Cigna annual report below. You can navigate through the pages in the report by either clicking on the pages listed below, or by using the keyword search tool below to find specific information within the annual report.-
 1
1 -
2
-
3
-
4
-
5
-
6
-
7
-
8
-
9
-
10
-
11
-
12
-
13
-
14
-
15
-
16
-
17
-
18
-
19
-
20
-
21
-
22
-
23
-
24
-
25
-
26
-
27
-
28
-
29
-
30
-
31
-
32
-
33
-
34
-
35
-
36
-
37
-
38
-
39
-
40
-
41
-
42
-
43
-
44
-
45
-
46
-
47
-
48
-
49
-
50
-
51
-
52
-
53
-
54
-
55
-
56
-
 57
57 -
 58
58 -
 59
59 -
 60
60 -
 61
61 -
 62
62 -
 63
63 -
 64
64 -
 65
65 -
 66
66 -
 67
67 -
 68
68 -
 69
69 -
 70
70 -
 71
71 -
 72
72 -
 73
73 -
 74
74 -
 75
75 -
 76
76 -
 77
77 -
78
-
79
-
80
-
81
-
82
-
83
-
84
-
85
-
86
-
87
-
88
-
89
-
90
-
91
-
92
-
93
-
94
-
95
-
96
-
97
-
98
-
99
-
100
-
101
-
102
-
103
-
104
-
105
-
106
-
107
-
108
-
109
-
110
-
111
-
112
-
113
-
114
-
115
-
116
-
117
-
118
-
119
-
120
-
121
-
122
-
123
-
124
-
125
-
126
-
127
-
128
-
129
-
130
-
131
-
132
-
133
-
134
-
135
-
136
-
137
-
138
-
139
-
140
-
141
-
142
-
143
-
144
-
145
-
146
-
147
-
148
-
149
-
150
-
151
-
152
-
153
-
154
-
155
-
156
-
157
-
158
-
159
-
160
-
161
-
162
-
163
-
164
-
165
-
166
-
167
-
168
-
169
-
170
-
171
-
172
-
173
-
174
-
175
-
176
-
177
-
178
-
179
-
180
-
181
-
182
 |
 |

PART II
ITEM 7 Management’s Discussion and Analysis of Financial Condition and Results of Operations
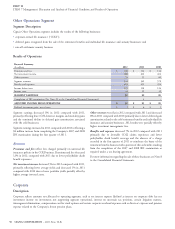
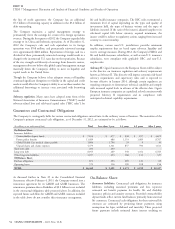
Results of Operations
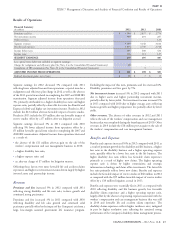
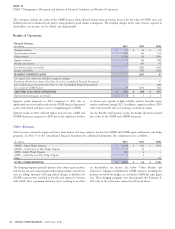
Financial Summary
(In millions)
2012 2011 2010
Premiums and fees $ 3,109 $ 2,857 $ 2,770
Net investment income 300 291 287
Other revenues - - 123
Segment revenues 3,409 3,148 3,180
Benefits and expenses 3,014 2,740 2,748
Income before taxes 395 408 432
Income taxes 116 113 127
SEGMENT EARNINGS 279 295 305
Less: special items (after-tax) included in segment earnings:
Charge for realignment and efficiency plan (See Note 6 to the Consolidated Financial Statements) (2) - -
Completion of IRS examination (See Note 20 to the Consolidated Financial Statements) - 5 -
ADJUSTED INCOME FROM OPERATIONS $ 281 $ 290 $ 305
Realized investment gains, net of taxes $ 18 $ 7 $ 13
Segment earnings for 2012 decreased 5% compared with 2011 Excluding the impact of this item, premiums and fees increased 6%.
reflecting lower adjusted income from operations, a special item for a Disability premiums and fees grew by 9%.
realignment and efficiency plan charge in 2012 as well as the absence Net investment income increased 3% in 2012 compared with 2011
of the 2011 special item related to completing the 2007 and 2008 IRS due to higher assets and higher partnership investment income,
examination. Segment adjusted income from operations decreased partially offset by lower yields. Net investment income increased 1%
3%, primarily attributable to a higher disability loss ratio and higher in 2011 compared with 2010 due to higher average assets reflecting
expense ratio, partially offset by a lower life loss ratio (see Benefits and business growth and higher prepayment fees partially offset by lower
Expenses below) and higher net investment income. Results in 2012 yields.
include the $43 million after-tax favorable impact of reserve studies.
Results in 2011 include the $39 million after-tax favorable impact of Other revenues. The absence of other revenues in 2012 and 2011
reserve studies offset by a $7 million after-tax litigation accrual. reflects the sale of the workers’ compensation and case management
business that was completed during the fourth quarter of 2010. Other
Segment earnings decreased 3% in 2011 compared with 2010 revenues in 2010 include the $18 million pre-tax gain on the sale of
reflecting 5% lower adjusted income from operations offset by a the workers’ compensation and case management business.
$5 million favorable special item related to completing the 2007 and
2008 IRS examinations. Adjusted income from operations decreased
as a result of:
Benefits and Expenses
the absence of the $11 million after-tax gain on the sale of the Benefits and expenses increased 10% in 2012 compared with 2011 as
workers’ compensation and case management business in 2010; a result of premium growth in the disability and life business, a higher
loss ratio in the disability business and a higher operating expense
a higher disability loss ratio; ratio, partially offset by a lower loss ratio in the life business. The
a higher expense ratio: and higher disability loss ratio reflects less favorable claim experience
primarily as a result of higher new claims. The higher operating
an after-tax charge of $7 million for litigation matters. expense ratio is driven by higher commissions and strategic
Offsetting these factors were more favorable life and accident claims information technology and claim office investments. The lower life
experience and higher net investment income driven largely by higher loss ratio primarily reflects lower new claims. Benefits and expenses
invested assets and partnership income. include the favorable impact of reserve studies of $60 million in 2012
as compared with the $59 million favorable impact of reserve studies
offset by a $10 million litigation accrual in 2011.
Revenues
Benefits and expenses were essentially flat in 2011 as compared with
Premiums and fees increased 9% in 2012 compared with 2011 2010 reflecting disability and life business growth, less favorable
reflecting strong disability and life new sales, in-force growth and disability claims experience and a higher operating expense ratio,
continued strong persistency. largely offset by the absence of operating expenses associated with the
workers’ compensation and case management business that was sold
Premiums and fees increased 3% in 2011 compared with 2010
in 2010 and favorable life and accident claims experience. The
reflecting disability and life sales growth and continued solid
disability claims experience reflects higher incidence rates, mitigated
persistency partially offset by the impact of the Company’s exit from a
in part by higher resolution rates reflecting the sustained strong
large, low-margin assumed government life insurance program.
performance of the Company’s disability claims management process.
CIGNA CORPORATION - 2012 Form 10-K 45
•
•
•
•