Cigna 2012 Annual Report Download - page 144
Download and view the complete annual report
Please find page 144 of the 2012 Cigna annual report below. You can navigate through the pages in the report by either clicking on the pages listed below, or by using the keyword search tool below to find specific information within the annual report.-
 1
1 -
2
-
3
-
4
-
5
-
6
-
7
-
8
-
9
-
10
-
11
-
12
-
13
-
14
-
15
-
16
-
17
-
18
-
19
-
20
-
21
-
22
-
23
-
24
-
25
-
26
-
27
-
28
-
29
-
30
-
31
-
32
-
33
-
34
-
35
-
36
-
37
-
38
-
39
-
40
-
41
-
42
-
43
-
44
-
45
-
46
-
47
-
48
-
49
-
50
-
51
-
52
-
53
-
54
-
55
-
56
-
57
-
58
-
59
-
60
-
61
-
62
-
63
-
64
-
65
-
66
-
67
-
68
-
69
-
70
-
71
-
72
-
73
-
74
-
75
-
76
-
77
-
78
-
79
-
80
-
81
-
82
-
83
-
84
-
85
-
86
-
87
-
88
-
89
-
90
-
91
-
92
-
93
-
94
-
95
-
96
-
97
-
98
-
99
-
100
-
101
-
102
-
103
-
104
-
105
-
106
-
107
-
108
-
109
-
110
-
111
-
112
-
113
-
114
-
115
-
116
-
117
-
118
-
119
-
120
-
121
-
122
-
123
-
124
-
125
-
126
-
127
-
128
-
129
-
130
-
131
-
132
-
133
-
 134
134 -
 135
135 -
 136
136 -
 137
137 -
 138
138 -
 139
139 -
 140
140 -
 141
141 -
 142
142 -
 143
143 -
 144
144 -
 145
145 -
 146
146 -
 147
147 -
 148
148 -
 149
149 -
 150
150 -
 151
151 -
 152
152 -
 153
153 -
 154
154 -
155
-
156
-
157
-
158
-
159
-
160
-
161
-
162
-
163
-
164
-
165
-
166
-
167
-
168
-
169
-
170
-
171
-
172
-
173
-
174
-
175
-
176
-
177
-
178
-
179
-
180
-
181
-
182
 |
 |

PART II
ITEM 8 Financial Statements and Supplementary Data
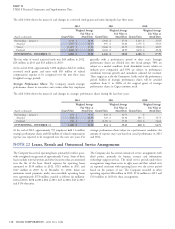
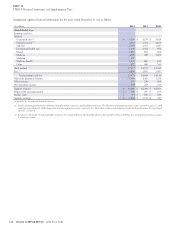
Premiums and fees, mail order pharmacy revenues and other revenues by product type were as follows for the years ended December 31:
(In millions)
2012 2011 2010
Medical $ 20,973 $ 14,443 $ 14,134
Disability 1,413 1,268 1,167
Supplemental Health, Life, and Accident 3,680 3,117 2,834
Mail order pharmacy 1,623 1,447 1,420
Other 242 382 393
TOTAL $ 27,931 $ 20,657 $ 19,948
Premiums and fees, mail order pharmacy revenues and other revenues by geographic location were as follows for the years ended December 31:
(In millions)
2012 2011 2010
U.S. $ 25,217 $ 18,522 $ 18,326
South Korea 1,076 909 717
All other foreign 1,638 1,226 905
TOTAL $ 27,931 $ 20,657 $ 19,948
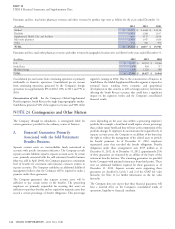
Consolidated pre-tax income from continuing operations is primarily segment’s earnings in 2012. Due to the concentration of business in
attributable to domestic operations. Consolidated pre-tax income South Korea, the Global Supplemental Benefits segment is exposed to
from continuing operations generated by the Company’s foreign potential losses resulting from economic and geopolitical
operations was approximately 8% in 2012, 10% in 2011 and 9% in developments in that country, as well as foreign currency movements
2010. affecting the South Korean currency, that could have a significant
impact on the segment’s results and the Company’s consolidated
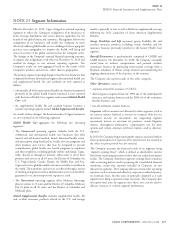
Concentration of risk. For the Company’s Global Supplemental financial results.
Benefits segment, South Korea is the single largest geographic market.
South Korea generated 54% of the segment’s revenues and 90% of the
Contingencies and Other Matters
The Company, through its subsidiaries, is contingently liable for varies depending on the asset class within a sponsoring employer’s
various guarantees provided in the ordinary course of business. portfolio (for example, a bond fund would require a lower percentage
than a riskier equity fund) and thus will vary as the composition of the
portfolio changes. If employers do not maintain the required levels of
A. Financial Guarantees Primarily
separate account assets, the Company or an affiliate of the buyer has
Associated with the Sold Retirement
the right to redirect the management of the related assets to provide
for benefit payments. As of December 31, 2012, employers
Benefits Business
maintained assets that exceeded the benefit obligations. Benefit
Separate account assets are contractholder funds maintained in obligations under these arrangements were $559 million as of
accounts with specific investment objectives. The Company records December 31, 2012. As of December 31, 2012, approximately 21%
separate account liabilities equal to separate account assets. In certain of these guarantees are reinsured by an affiliate of the buyer of the
cases, primarily associated with the sold retirement benefits business retirement benefits business. The remaining guarantees are provided
(that was sold in April 2004), the Company guarantees a minimum by the Company with minimal reinsurance from third parties. There
level of benefits for retirement and insurance contracts written in were no additional liabilities required for these guarantees as of
separate accounts. The Company establishes an additional liability if December 31, 2012. Separate account assets supporting these
management believes that the Company will be required to make a guarantees are classified in Levels 1 and 2 of the GAAP fair value
payment under these guarantees. hierarchy. See Note 11 for further information on the fair value
hierarchy.
The Company guarantees that separate account assets will be
sufficient to pay certain retiree or life benefits. The sponsoring The Company does not expect that these financial guarantees will
employers are primarily responsible for ensuring that assets are have a material effect on the Company’s consolidated results of
sufficient to pay these benefits and are required to maintain assets that operations, liquidity or financial condition.
exceed a certain percentage of benefit obligations. This percentage
122 CIGNA CORPORATION - 2012 Form 10-K
NOTE 24