Chevron 2011 Annual Report Download - page 83
Download and view the complete annual report
Please find page 83 of the 2011 Chevron annual report below. You can navigate through the pages in the report by either clicking on the pages listed below, or by using the keyword search tool below to find specific information within the annual report.-
 1
1 -
2
-
3
-
4
-
5
-
6
-
7
-
8
-
9
-
10
-
11
-
12
-
13
-
14
-
15
-
16
-
17
-
18
-
19
-
20
-
21
-
22
-
23
-
24
-
25
-
26
-
27
-
28
-
29
-
30
-
31
-
32
-
33
-
34
-
35
-
36
-
37
-
38
-
39
-
40
-
41
-
42
-
43
-
44
-
45
-
46
-
47
-
48
-
49
-
50
-
51
-
52
-
53
-
54
-
55
-
56
-
57
-
58
-
59
-
60
-
61
-
62
-
63
-
64
-
65
-
66
-
67
-
68
-
69
-
70
-
71
-
72
-
 73
73 -
 74
74 -
 75
75 -
 76
76 -
 77
77 -
 78
78 -
 79
79 -
 80
80 -
 81
81 -
 82
82 -
 83
83 -
 84
84 -
 85
85 -
 86
86 -
 87
87 -
 88
88 -
 89
89 -
 90
90 -
 91
91 -
 92
92
 |
 |

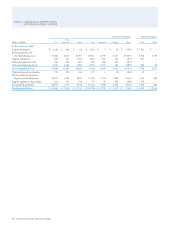
Table V Reserve Quantity Information – Continued
Net Proved Reserves of Natural Gas
Total
Consolidated Companies
Aliated Companies Consolidated
Other
and Aliated
Billions of cubic feet (BCF) U.S. Americas1 Africa Asia Australia Europe Total TCO Other2 Companies
Reserves at January 1, 2009 3,150 2,368 3,056 7,996 1,962 490 19,022 3,175 878 23,075
Changes attributable to:
Revisions 39 (126) 4 493 166 (7) 569 (237) 193 525
Improved recovery – – – – – – – – – –
Extensions and discoveries 53 1 3 54 4,276 – 4,387 – – 4,387
Purchases – – – – – – – – – –
Sales (33) (84) – – – – (117) – – (117)
Production3 (511) (174) (42) (683) (159) (139) (1,708) (105) (8) (1,821)
Reserves at December 31, 20094 2,698 1,985 3,021 7,860 6,245 344 22,153 2,833 1,063 26,049
Changes attributable to:
Revisions 220 4 (20) (31) (22) 46 197 (324) 56 (71)
Improved recovery 1 1 – – – – 2 – – 2
Extensions and discoveries 36 4 – 59 – 11 110 – – 110
Purchases 3 – – 4 – – 7 – – 7
Sales (7) – – – – – (7) – – (7)
Production3 (479) (179) (57) (699) (167) (126) (1,707) (123) (9) (1,839)
Reserves at December 31, 20104 2,472 1,815 2,944 7,193 6,056 275 20,755 2,386 1,110 24,251
Changes attributable to:
Revisions 217 (4) 39 196 (107) 74 415 (21) 103 497
Improved recovery – 1 – – – – 1 – – 1
Extensions and discoveries 287 13 290 46 4,035 9 4,680 – – 4,680
Purchases 1,231 – – 2 – – 1,233 – – 1,233
Sales (95) – – (2) (77) – (174) – – (174)
Production3 (466) (161) (77) (714) (163) (100) (1,681) (114) (10) (1,805)
Reserves at December 31, 20114 3,646 1,664 3,196 6,721 9,744 258 25,229 2,251 1,203 28,683
1 Ending reserve balances in North America and South America were 19, 21, 23 and 1,645, 1,794, 1,962 in 2011, 2010 and 2009, respectively.
2 Ending reserve balances in Africa and South America were 1,016, 953, 898 and 187, 157, 165 in 2011, 2010 and 2009, respectively.
3 Total “as sold” volumes are 4.4 BCF, 4.5 BCF and 4.5 BCF for 2011, 2010 and 2009, respectively.
4 Includes reserve quantities related to production-sharing contracts (PSC) (refer to page 8 for the denition of a PSC). PSC-related reserve quantities are 21 percent,
29 percent and 31 percent for consolidated companies for 2011, 2010 and 2009, respectively.
Noteworthy amounts in the categories of natural gas
proved-reserve changes for 2009 through 2011 are dis-
cussed below:
Revisions In 2009, net revisions increased reserves
569 BCF for consolidated companies and decreased reserves
44 BCF for aliated companies. For consolidated companies,
net increases were 493 BCF in Asia, primarily as a result of
reservoir studies in Bangladesh and development drilling in
ailand. ese results were partially oset by a downward
revision due to the impact of higher prices on production-
sharing contracts in Myanmar. In Australia, the 166 BCF
increase in reserves resulted from improved reservoir per-
formance and compression. In Other Americas, reserves
decreased 126 BCF, driven primarily by the eect of higher
prices on production-sharing contracts in Trinidad and
Tobago. In the United States, a net increase of 39 BCF was
the result of development drilling in the Gulf of Mexico,
partially oset by performance revisions in the California
and mid-continent areas.
For equity aliates, a downward revision of 237 BCF at
TCO was due to the eect of higher prices on royalty determi-
nation and an increase in gas injection for SGI/SGP facilities.
is decline was partially oset by performance and drilling
opportunities related to the Angola LNG project.
In 2010, net revisions increased reserves by 197 BCF for
consolidated companies, which was more than oset by a
268 BCF decrease in net revisions for aliated companies. For
consolidated companies, a net increase in the United States of
220 BCF, primarily in the mid-continent area and the Gulf of
Mexico, was the result of a number of small upward revisions
related to improved reservoir performance and drilling activ-
ity, none of which were individually signicant. e increase
was partially oset by downward revisions due to the impact
of higher prices on production-sharing contracts in Asia. For
equity aliates, a downward revision of 324 BCF at TCO was
due to the price eect on royalty determination and a change in
the variable-royalty calculation. is decline was partially oset
by the recognition of additional reserves related to the Angola
LNGproject.
Chevron Corporation 2011 Annual Report 81