Chevron 2011 Annual Report Download - page 49
Download and view the complete annual report
Please find page 49 of the 2011 Chevron annual report below. You can navigate through the pages in the report by either clicking on the pages listed below, or by using the keyword search tool below to find specific information within the annual report.-
 1
1 -
2
-
3
-
4
-
5
-
6
-
7
-
8
-
9
-
10
-
11
-
12
-
13
-
14
-
15
-
16
-
17
-
18
-
19
-
20
-
21
-
22
-
23
-
24
-
25
-
26
-
27
-
28
-
29
-
30
-
31
-
32
-
33
-
34
-
35
-
36
-
37
-
38
-
 39
39 -
 40
40 -
 41
41 -
 42
42 -
 43
43 -
 44
44 -
 45
45 -
 46
46 -
 47
47 -
 48
48 -
 49
49 -
 50
50 -
 51
51 -
 52
52 -
 53
53 -
 54
54 -
 55
55 -
 56
56 -
 57
57 -
 58
58 -
 59
59 -
60
-
61
-
62
-
63
-
64
-
65
-
66
-
67
-
68
-
69
-
70
-
71
-
72
-
73
-
74
-
75
-
76
-
77
-
78
-
79
-
80
-
81
-
82
-
83
-
84
-
85
-
86
-
87
-
88
-
89
-
90
-
91
-
92
 |
 |

Chevron Corporation 2011 Annual Report 47
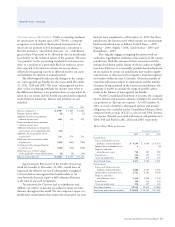
Segment Income Taxes Segment income tax expense for the
years 2011, 2010 and 2009 is as follows:
Year ended December 31
2011 2010 2009
Upstream
United States $ 3,701 $ 2,285 $ 1,251
International 16,743 10,480 7,451
Total Upstream 20,444 12,765 8,702
Downstream
United States 785 680 (83)
International 416 462 463
Total Downstream 1,201 1,142 380
All Other (1,019) (988) (1,117)
Total Income Tax Expense $ 20,626 $ 12,919 $ 7,965
Other Segment Information Additional information for
thesegmentation of major equity affiliates is contained in
Note 12, beginning on page 47. Information related to
proper ties, plant and equipment by segment is contained in
Note 13, on page 49.
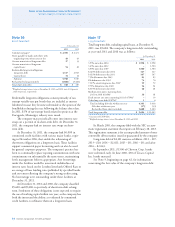
Note 12
Investments and Advances
Equity in earnings, together with investments in and advances
to companies accounted for using the equity method and other
investments accounted for at or below cost, is shown in the fol-
lowing table. For certain equity aliates, Chevron pays its share
of some income taxes directly. For such aliates, the equity in
earnings does not include these taxes, which are reported on the
Consolidated Statement of Income as “Income tax expense.”
Investments and Advances Equity in Earnings
At December 31 Year ended December 31
2011 2010 2011 2010 2009
Upstream
Tengizchevroil $ 5,306 $ 5,789 $ 5,097 $ 3,398 $2,216
Petropiar 909 973 116 262 122
Caspian Pipeline Consortium 1,094 974 122 124 105
Petroboscan 1,032 937 247 222 171
Angola LNG Limited 2,921 2,481 (42) (21) (12)
Other 2,420 1,922 166 319 287
Total Upstream 13,682 13,076 5,706 4,304 2,889
Downstream
GS Caltex Corporation 2,572 2,496 248 158 (191)
Chevron Phillips Chemical
Company LLC 2,909 2,419 985 704 328
Star Petroleum Rening
Company Ltd. 1,022 947 75 122 (4)
Caltex Australia Ltd. 819 767 117 101 11
Colonial Pipeline Company – – – 43 51
Other 630 602 183 151 149
Total Downstream 7,952 7,231 1,608 1,279 344
All Other
Other 516 509 49 54 83
Total equity method $ 22,150 $ 20,816 $ 7,363 $ 5,637 $ 3,316
Other at or below cost 718 704
Total investments and
advances $ 22,868 $ 21,520
Total United States $ 4,847 $ 3,769 $ 1,119 $ 846 $ 511
Total International $ 18,021 $ 17,751 $ 6,244 $ 4,791 $ 2,805
Descriptions of major affiliates, including signicant
dierences between the company’s carrying value of its
investments and its underlying equity in the net assets of
the aliates, are as follows:
Tengizchevroil Chevron has a 50 percent equity ownership
interest in Tengizchevroil (TCO), a joint venture formed in
1993 to develop the Tengiz and Korolev crude oil elds in
Kazakhstan over a 40-year period. At December 31, 2011, the
company’s carrying value of its investment in TCO was about
$180 higher than the amount of underlying equity in TCO’s
net assets. is dierence results from Chevron acquiring
aportion of its interest in TCO at a value greater than the
underlying book value for that portion of TCO’s net assets.
See Note 7, on page 41, for summarized nancial
informa tion for 100 percent of TCO.
Note 11 Operating Segments and Geographic Data – Continued