Chevron 2011 Annual Report Download - page 48
Download and view the complete annual report
Please find page 48 of the 2011 Chevron annual report below. You can navigate through the pages in the report by either clicking on the pages listed below, or by using the keyword search tool below to find specific information within the annual report.-
 1
1 -
2
-
3
-
4
-
5
-
6
-
7
-
8
-
9
-
10
-
11
-
12
-
13
-
14
-
15
-
16
-
17
-
18
-
19
-
20
-
21
-
22
-
23
-
24
-
25
-
26
-
27
-
28
-
29
-
30
-
31
-
32
-
33
-
34
-
35
-
36
-
37
-
 38
38 -
 39
39 -
 40
40 -
 41
41 -
 42
42 -
 43
43 -
 44
44 -
 45
45 -
 46
46 -
 47
47 -
 48
48 -
 49
49 -
 50
50 -
 51
51 -
 52
52 -
 53
53 -
 54
54 -
 55
55 -
 56
56 -
 57
57 -
 58
58 -
59
-
60
-
61
-
62
-
63
-
64
-
65
-
66
-
67
-
68
-
69
-
70
-
71
-
72
-
73
-
74
-
75
-
76
-
77
-
78
-
79
-
80
-
81
-
82
-
83
-
84
-
85
-
86
-
87
-
88
-
89
-
90
-
91
-
92
 |
 |

46 Chevron Corporation 2011 Annual Report
Note 11 Operating Segments and Geographic Data – Continued
Notes to the Consolidated Financial Statements
Millions of dollars, except per-share amounts
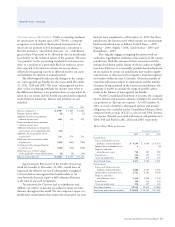
“All Other.” Earnings by major operating area are presented
in the following table:
Year ended December 31
2011 2010 2009
Segment Earnings
Upstream
United States $ 6,512 $ 4,122 $ 2,262
International 18,274 13,555 8,670
Total Upstream 24,786 17,677 10,932
Downstream
United States 1,506 1,339 (121)
International 2,085 1,139 594
Total Downstream 3,591 2,478 473
Total Segment Earnings 28,377 20,155 11,405
All Other
Interest expense – (41) (22)
Interest income 78 70 46
Other (1,560) (1,160) (946)
Net Income Attributable
to Chevron Corporation $ 26,895 $ 19,024 $ 10,483
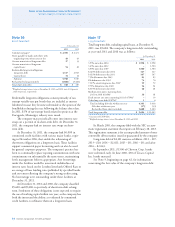
Segment Assets Segment assets do not include intercompany
investments or intercompany receivables. Segment assets at
year-end 2011 and 2010 are as follows:
At December 31
2011 2010
Upstream
United States $ 37,108 $ 26,319
International 98,540 89,306
Goodwill 4,642 4,617
Total Upstream 140,290 120,242
Downstream
United States 22,182 21,406
International 20,517 20,559
Total Downstream 42,699 41,965
Total Segment Assets 182,989 162,207
All Other*
United States 8,824 11,125
International 17,661 11,437
Total All Other 26,485 22,562
Total Assets – United States 68,114 58,850
Total Assets – International 136,718 121,302
Goodwill 4,642 4,617
Total Assets $ 209,474 $ 184,769
* “All Other” assets consist primarily of worldwide cash, cash equivalents, time
deposits and marketable securities, real estate, energy services, information
systems, mining operations, power generation businesses, alternative fuels and tech-
nology companies, and assets of the corporate administrative functions.
Segment Sales and Other Operating Revenues Operating seg-
ment sales and other operating revenues, including internal
transfers, for the years 2011, 2010 and 2009, are presented
in the table that follows. Products are transferred between
operating segments at internal product values that approxi-
mate market prices.
Revenues for the upstream segment are derived primarily
from the production and sale of crude oil and natural gas,
as well as the sale of third-party production of natural gas.
Revenues for the downstream segment are derived from the
rening and marketing of petroleum products such as gaso-
line, jet fuel, gas oils, lubricants, residual fuel oils and
other products derived from crude oil. is segment also
generates revenues from the manufacture and sale of addi-
tives for fuels and lubricant oils and the transportation and
trading of rened products, crude oil and natural gas liquids.
“All Other” activities include revenues from mining opera-
tions, power generation businesses, insurance operations, real
estate activities, energy services, alternative fuels and technol-
ogy companies.
Other than the United States, no single country accounted
for 10 percent or more of the company’s total sales and other
operating revenues in 2011, 2010 and 2009.
Year ended December 31
2011 2010 2009*
Upstream
United States $ 9,623 $ 10,316 $ 9,225
Intersegment 18,115 13,839 10,297
Total United States 27,738 24,155 19,522
International 20,086 17,300 13,463
Intersegment 35,012 23,834 18,477
Total International 55,098 41,134 31,940
Total Upstream 82,836 65,289 51,462
Downstream
United States 86,793 70,436 58,056
Excise and similar taxes 4,199 4,484 4,573
Intersegment 86 115 98
Total United States 91,078 75,035 62,727
International 119,254 90,922 77,845
Excise and similar taxes 3,886 4,107 3,536
Intersegment 81 93 87
Total International 123,221 95,122 81,468
Total Downstream 214,299 170,157 144,195
All Other
United States 526 610 665
Intersegment 1,072 947 964
Total United States 1,598 1,557 1,629
International 4 23 39
Intersegment 42 39 33
Total International 46 62 72
Total All Other 1,644 1,619 1,701
Segment Sales and Other
Operating Revenues
United States 120,414 100,747 83,878
International 178,365 136,318 113,480
Total Segment Sales and Other
Operating Revenues 298,779 237,065 197,358
Elimination of intersegment sales (54,408) (38,867) (29,956)
Total Sales and Other
Operating Revenues $ 244,371 $ 198,198 $167,402
*2009 conformed with 2010 and 2011 presentation.