Chevron 2011 Annual Report Download - page 74
Download and view the complete annual report
Please find page 74 of the 2011 Chevron annual report below. You can navigate through the pages in the report by either clicking on the pages listed below, or by using the keyword search tool below to find specific information within the annual report.-
 1
1 -
2
-
3
-
4
-
5
-
6
-
7
-
8
-
9
-
10
-
11
-
12
-
13
-
14
-
15
-
16
-
17
-
18
-
19
-
20
-
21
-
22
-
23
-
24
-
25
-
26
-
27
-
28
-
29
-
30
-
31
-
32
-
33
-
34
-
35
-
36
-
37
-
38
-
39
-
40
-
41
-
42
-
43
-
44
-
45
-
46
-
47
-
48
-
49
-
50
-
51
-
52
-
53
-
54
-
55
-
56
-
57
-
58
-
59
-
60
-
61
-
62
-
63
-
 64
64 -
 65
65 -
 66
66 -
 67
67 -
 68
68 -
 69
69 -
 70
70 -
 71
71 -
 72
72 -
 73
73 -
 74
74 -
 75
75 -
 76
76 -
 77
77 -
 78
78 -
 79
79 -
 80
80 -
 81
81 -
 82
82 -
 83
83 -
 84
84 -
85
-
86
-
87
-
88
-
89
-
90
-
91
-
92
 |
 |

72 Chevron Corporation 2011 Annual Report
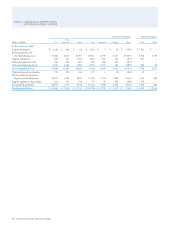
Consolidated Companies Aliated Companies
Other
Millions of dollars U.S. Americas Africa Asia Australia Europe Total TCO Other
At December 31, 2009
Unproved properties $ 2,320 $ 946 $ 321 $ 3,355 $ 7 $ 10 $ 6,959 $ 113 $ –
Proved properties and
related producing assets 51,582 6,033 20,967 29,637 2,507 8,727 119,453 6,404 1,759
Support equipment 810 323 1,012 1,383 162 163 3,853 947 –
Deferred exploratory wells 762 216 603 209 440 205 2,435 – –
Other uncompleted projects 2,384 4,106 3,960 2,936 1,274 192 14,852 284 58
Gross Capitalized Costs 57,858 11,624 26,863 37,520 4,390 9,297 147,552 7,748 1,817
Unproved properties valuation 915 391 163 170 1 (2) 1,638 32 –
Proved producing properties –
Depreciation and depletion 34,574 3,182 8,823 15,783 1,579 6,482 70,423 1,150 282
Support equipment depreciation 424 197 526 773 58 102 2,080 356 –
Accumulated provisions 35,913 3,770 9,512 16,726 1,638 6,582 74,141 1,538 282
Net Capitalized Costs $ 21,945 $ 7,854 $ 17,351 $ 20,794 $ 2,752 $ 2,715 $ 73,411 $ 6,210 $ 1,535
Table II Capitalized Costs Related to Oil and
Gas Producing Activities – Continued