Chevron 2011 Annual Report Download - page 22
Download and view the complete annual report
Please find page 22 of the 2011 Chevron annual report below. You can navigate through the pages in the report by either clicking on the pages listed below, or by using the keyword search tool below to find specific information within the annual report.-
 1
1 -
2
-
3
-
4
-
5
-
6
-
7
-
8
-
9
-
10
-
11
-
 12
12 -
 13
13 -
 14
14 -
 15
15 -
 16
16 -
 17
17 -
 18
18 -
 19
19 -
 20
20 -
 21
21 -
 22
22 -
 23
23 -
 24
24 -
 25
25 -
 26
26 -
 27
27 -
 28
28 -
 29
29 -
 30
30 -
 31
31 -
 32
32 -
33
-
34
-
35
-
36
-
37
-
38
-
39
-
40
-
41
-
42
-
43
-
44
-
45
-
46
-
47
-
48
-
49
-
50
-
51
-
52
-
53
-
54
-
55
-
56
-
57
-
58
-
59
-
60
-
61
-
62
-
63
-
64
-
65
-
66
-
67
-
68
-
69
-
70
-
71
-
72
-
73
-
74
-
75
-
76
-
77
-
78
-
79
-
80
-
81
-
82
-
83
-
84
-
85
-
86
-
87
-
88
-
89
-
90
-
91
-
92
 |
 |

Management’s Discussion and Analysis of
Financial Condition and Results of Operations
20 Chevron Corporation 2011 Annual Report
Management’s Discussion and Analysis of
Financial Condition and Results of Operations
by aliates. Approximately 87 percent of thetotal, or
$28.5 billion, is budgeted for exploration and production
activities. Approximately $22.3 billion, or 78 percent, of this
amount is for projects outside the United States. Spending in
2012 is primarily focused on major development projects in
Angola, Australia, Brazil, Canada, China, Kazakhstan,
Nigeria, Russia, the United Kingdom and the U.S. Gulf of
Mexico. Also included is funding for enhancing recovery and
mitigating natural eld declines for currently-producing assets,
and for focused exploration and appraisal activities.
Worldwide downstream spending in 2012 is estimated at
$3.6 billion, with about $2.1 billion for projects in the United
States. Major capital outlays include projects under con-
struction at reneries in the United States and South Korea,
expansion of additives production capacity in Singapore, and
chemicals projects in the United States and Saudi Arabia.
Investments in technology, power generation and other
corporate businesses in 2012 are budgeted at $600 million.
Noncontrolling interests e company had noncontrolling
interests of $799 million and $730 million at December 31,
2011 and 2010, respectively. Distributions to noncontrolling
interests totaled $71 million and $72 million in 2011 and
2010, respectively.
Pension Obligations Information related to pension
plan contributions is included on page 57 in Note 21 to
the Consolidated Financial Statements under the heading
“Cash Contributions and Benet Payments.” Refer also to
the discussion of pension accounting in “Critical Accounting
Estimates and Assumptions,” beginning on page 24.
Financial Ratios
Financial Ratios
At December 31
2011 2010 2009
Current Ratio 1.6 1.7 1.4
Interest Coverage Ratio 165.4 101.7 62.3
Debt Ratio 7.7% 9.8% 10.3%
Current Ratio – current assets divided by current
liabilities, which indicates the company’s ability to repay its
short-term liabilities with short-term assets. e current ratio
in all periods was adversely aected by the fact that Chevron’s
inventories are valued on a last-in, rst-out basis. At year-end
2011, the book value of inventory was lower than replacement
costs, based on average acquisition costs during the year, by
approximately $9.0 billion.
Interest Coverage Ratio – income before income tax
expense, plus interest and debt expense and amortization of
capitalized interest, less net income attributable to noncon-
trolling interests, divided by before-tax interest costs. is
ratio indicates the company’s
ability to pay interest on
outstanding debt. e com-
pany’s interest coverage ratio
in 2011 was higher than
2010 and 2009 due to higher
before-tax income.
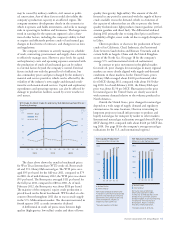
Debt Ratio – total debt
as a percentage of total debt
plus Chevron Corporation
Stockholders’ Equity, which
indicates the company’s
leverage. e decrease
between 2011 and 2010 was
due to lower debt and a
higher Chevron Corporation
stockholders’ equity balance.
e decrease between 2010
and 2009 was due to a
higher Chevron Corporation
stockholders’ equity balance.
Guarantees, Off-Balance-Sheet Arrangements and
Contractual Obligations, and Other Contingencies
Direct Guarantee
Millions of dollars Commitment Expiration by Period
2013– 2015– After
Total 2012 2014 2016 2016
Guarantee of non-
consolidated aliate or
joint-venture obligation $ 601 $ 38 $ 77 $ 77 $ 409
e company’s guarantee of approximately $600 million
is associated with certain payments under a terminal use
agreement entered into by a company aliate. e terminal
commenced operations in third quarter 2011. Over the
approximate 16-year term of the guarantee, the maximum
guarantee amount will be reduced over time as certain fees
are paid by the aliate. ere are numerous cross-indemnity
agreements with the aliate and the other partners to permit
recovery ofamounts paid under the guarantee. Chevron has
recorded no liability for its obligation under this guarantee.
Indemnications Information related to indemnications
is included on page 64 in Note 24 to the Consolidated
Financial Statements under the heading “Indemnications.”
Long-Term Unconditional Purchase Obligations and
Commitments, Including roughput and Take-or-Pay Agree-
ments e company and its subsidiaries have certain other
contingent liabilities with respect to long-term unconditional
purchase obligations and commitments, including throughput
and take-or-pay agreements, some of which relate to suppliers’
0.0
150.0
30.0
90.0
120.0
60.0
0
50
40
30
20
10
Debt Ratio
Billions of dollars/Percent
Debt (left scale)
CVX Stockholders’ Equity (left scale)
Ratio (right scale)
The ratio of total debt to total
debt-plus-Chevron Corporation
Stockholders’ Equity decreased to
7.7 percent at the end of 2011 due to
lower debt and an increase in
Stockholders’ Equity.
0807 09 10 11
$131.5