Chevron 2011 Annual Report Download - page 20
Download and view the complete annual report
Please find page 20 of the 2011 Chevron annual report below. You can navigate through the pages in the report by either clicking on the pages listed below, or by using the keyword search tool below to find specific information within the annual report.-
 1
1 -
2
-
3
-
4
-
5
-
6
-
7
-
8
-
9
-
 10
10 -
 11
11 -
 12
12 -
 13
13 -
 14
14 -
 15
15 -
 16
16 -
 17
17 -
 18
18 -
 19
19 -
 20
20 -
 21
21 -
 22
22 -
 23
23 -
 24
24 -
 25
25 -
 26
26 -
 27
27 -
 28
28 -
 29
29 -
 30
30 -
31
-
32
-
33
-
34
-
35
-
36
-
37
-
38
-
39
-
40
-
41
-
42
-
43
-
44
-
45
-
46
-
47
-
48
-
49
-
50
-
51
-
52
-
53
-
54
-
55
-
56
-
57
-
58
-
59
-
60
-
61
-
62
-
63
-
64
-
65
-
66
-
67
-
68
-
69
-
70
-
71
-
72
-
73
-
74
-
75
-
76
-
77
-
78
-
79
-
80
-
81
-
82
-
83
-
84
-
85
-
86
-
87
-
88
-
89
-
90
-
91
-
92
 |
 |

Management’s Discussion and Analysis of
Financial Condition and Results of Operations
18 Chevron Corporation 2011 Annual Report
Management’s Discussion and Analysis of
Financial Condition and Results of Operations
Selected Operating Data1,2
2011 2010 2009
U.S. Upstream
Net Crude Oil and Natural Gas
Liquids Production (MBPD) 465 489 484
Net Natural Gas Production (MMCFPD)3 1,279 1,314 1,399
Net Oil-Equivalent Production (MBOEPD) 678 708 717
Sales of Natural Gas (MMCFPD) 5,836 5,932 5,901
Sales of Natural Gas Liquids (MBPD) 15 22 17
Revenues From Net Production
Liquids ($/Bbl) $ 97.51 $ 71.59 $ 54.36
Natural Gas ($/MCF) $ 4.04 $ 4.26 $ 3.73
International Upstream
Net Crude Oil and Natural Gas
Liquids Production (MBPD)4 1,384 1,434 1,362
Net Natural Gas Production (MMCFPD)3 3,662 3,726 3,590
Net Oil-Equivalent
Production (MBOEPD)5 1,995 2,055 1,987
Sales of Natural Gas (MMCFPD) 4,361 4,493 4,062
Sales of Natural Gas Liquids (MBPD) 24 27 23
Revenues From Liftings
Liquids ($/Bbl) $ 101.53 $ 72.68 $ 55.97
Natural Gas ($/MCF) $ 5.39 $ 4.64 $ 4.01
Worldwide Upstream
Net Oil-Equivalent Production
(MBOEPD)3,5
United States 678 708 717
International 1,995 2,055 1,987
Total 2,673 2,763 2,704
U.S. Downstream
Gasoline Sales (MBPD)6 649 700 720
Other Refined Product Sales (MBPD) 608 649 683
Total Rened Product Sales (MBPD) 1,257 1,349 1,403
Sales of Natural Gas Liquids (MBPD) 146 139 144
Refinery Input (MBPD) 854 890 899
International Downstream
Gasoline Sales (MBPD)6 447 521 555
Other Refined Product Sales (MBPD) 1,245 1,243 1,296
Total Rened Product Sales (MBPD)7 1,692 1,764 1,851
Sales of Natural Gas Liquids (MBPD) 63 78 88
Renery Input (MBPD) 933 1,004 979
1 Includes company share of equity aliates.
2 MBPD – thousands of barrels per day; MMCFPD – millions of cubic feet per day;
MBOEPD – thousands of barrels of oil-equivalents per day; Bbl – Barrel; MCF =
ousands of cubic feet. Oil-equivalent gas (OEG) conversion ratio is 6,000 cubic
feet of natural gas = 1 barrel of oil.
3 Includes natural gas consumed in operations (MMCFPD):
United States 69 62 58
International 513 475 463
4 Includes: Canada – synthetic oil 40 24 –
Venezuela aliate – synthetic oil 32 28 –
5 Includes Canada oil sands: – – 26
6 Includes branded and unbranded gasoline.
7 Includes sales of aliates (MBPD): 556 562 516
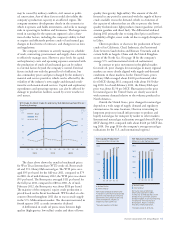
Liquidity and Capital Resources
Cash, cash equivalents, time deposits and marketable securities
Total balances were $20.1 billion and $17.1 billion at
December 31, 2011 and 2010, respectively. Cash provided
byoperating activities in 2011 was $41.1 billion, compared
with $31.4 billion in 2010 and $19.4 billion in 2009. Cash
provided by operating activities was net of contributions to
employee pension plans of approximately $1.5 billion, $1.4
billion and $1.7 billion in 2011, 2010 and 2009, respectively.
Cash provided by operating activities during 2011 was more
than sucient to fund the $27.4 billion cash component of
the company’s capital and exploratory program and pay $6.1
billion of dividends to shareholders. In addition, the com-
pany completed the $4.5 billion acquisition of Atlas Energy,
Inc., funded from the company’s operating cash ows. Cash
provided by investing activities included proceeds and deposits
related to asset sales of $3.5 billion in 2011, $2.0 billion in
2010, and $2.6billion in 2009.
Restricted cash of $1.2 billion and $855 million associated
with various capital-investment projects, acquisitions pending
tax deferred exchanges, and Upstream abandonment activities
at December 31, 2011 and 2010, respectively, was invested in
short-term marketable securities and recorded as “Deferred
charges and other assets” on the Consolidated Balance Sheet.
Dividends Dividends paid to common stockholders
were approximately $6.1 billion in 2011, $5.7 billion in 2010
and $5.3 billion in 2009. In October 2011, the company
increased its quarterly dividend by 3.8 percent to 81 cents
per common share. is followed an increase of 8.3 percent
announced in second quarter 2011.
0.0
45.0
18.0
27.0
9.0
36.0
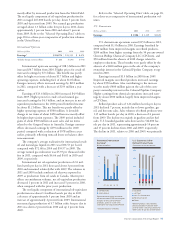
Cash Provided by
Operating Activities
Billions of dollars
Operating cash flows were
approximately $9.7 billion higher
than 2010 primarily due to higher
crude oil prices.
0807 09 10 11
$41.1
0.0
15.0
12.0
3.0
6.0
9.0
0.0
1.5
1.2
0.9
0.6
0.3
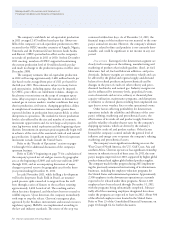
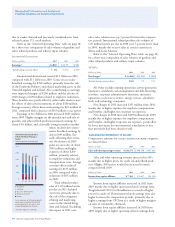
Total Interest Expense &
Total Debt at Year-End
Billions of dollars
Total Interest Expense
(right scale)
Total Debt (left scale)
Total debt decreased $1.3 billion
during 2011 to $10.2 billion. All
interest cost was capitalized as
part of the cost of major projects.
$10.2
0807 09 10 11