Chevron 2011 Annual Report Download - page 45
Download and view the complete annual report
Please find page 45 of the 2011 Chevron annual report below. You can navigate through the pages in the report by either clicking on the pages listed below, or by using the keyword search tool below to find specific information within the annual report.-
 1
1 -
2
-
3
-
4
-
5
-
6
-
7
-
8
-
9
-
10
-
11
-
12
-
13
-
14
-
15
-
16
-
17
-
18
-
19
-
20
-
21
-
22
-
23
-
24
-
25
-
26
-
27
-
28
-
29
-
30
-
31
-
32
-
33
-
34
-
 35
35 -
 36
36 -
 37
37 -
 38
38 -
 39
39 -
 40
40 -
 41
41 -
 42
42 -
 43
43 -
 44
44 -
 45
45 -
 46
46 -
 47
47 -
 48
48 -
 49
49 -
 50
50 -
 51
51 -
 52
52 -
 53
53 -
 54
54 -
 55
55 -
56
-
57
-
58
-
59
-
60
-
61
-
62
-
63
-
64
-
65
-
66
-
67
-
68
-
69
-
70
-
71
-
72
-
73
-
74
-
75
-
76
-
77
-
78
-
79
-
80
-
81
-
82
-
83
-
84
-
85
-
86
-
87
-
88
-
89
-
90
-
91
-
92
 |
 |

Chevron Corporation 2011 Annual Report 43
Note 9 Fair Value Measurements – Continued
Derivatives classied as Level 2 include swaps, options,
and forward contracts principally with nancial institutions
and other oil and gas companies, the fair values of which are
obtained from third-party broker quotes, industry pricing
services and exchanges. e company obtains multiple sources
of pricing information for the Level 2 instruments. Since this
pricing information is generated from observable market data,
it has historically been very consistent. e company does
not materially adjust this information. e company incorpo-
rates internal review, evaluation and assessment procedures,
including a comparison of Level 2 fair values derived from the
company’s internally developed forward curves (on a sample
basis) with the pricing information to document reasonable,
logical and supportable fair value determinations and proper
level of classication.
Impairments of “Properties, plant and equipment” e company
did not have any material long-lived assets measured at fair
value on a nonrecurring basis to report in 2011 or 2010.
Impairments of “Investments and advances” e company did
not have any material investments and advances measured at
fair value on a nonrecurring basis to report in 2011 or 2010.
Assets and Liabilities Not Required to Be Measured at Fair
Value e company holds cash equivalents and bank time
deposits in U.S. and non-U.S. portfolios. e instruments
classied as cash equivalents are primarily bank time depos-
its with maturities of 90 days or less and money market
funds. “Cash and cash equivalents” had carrying/fair values
of $15,864 and $14,060 at December 31, 2011, and Decem-
ber 31, 2010, respectively. e instruments held in “Time
deposits” are bank time deposits with maturities greater than
90 days, and had carrying/fair values of $3,958 and $2,855
at December 31, 2011, and December 31, 2010, respectively.
e fair values of cash, cash equivalents and bank time
deposits reect the cash that would have been received if the
instruments were settled at December 31, 2011.
“Cash and cash equivalents” do not include investments
with a carrying/fair value of $1,240 and $855 at December
31, 2011, and December 31, 2010, respectively. At December
31, 2011, these investments include restricted funds related to
various capital-investment projects, acquisitions pending tax
deferred exchanges, and Upstream abandonment activities
which are reported in “Deferred charges and other assets” on
the Consolidated Balance Sheet. Long-term debt of $4,101 and
$5,636 at December 31, 2011, and December 31, 2010, had
estimated fair values of $4,928 and $6,311, respectively.
e carrying values of short-term nancial assets and
liabilities on the Consolidated Balance Sheet approximate their
fair values. Fair value remeasurements of other nancial instru-
ments at December 31, 2011 and 2010 were not material.
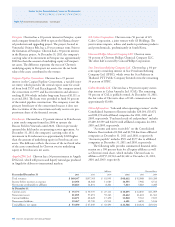
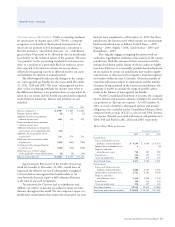
e fair value hierarchy for assets and liabilities measured at fair value on a nonrecurring basis at December 31, 2011, is as follows:
Assets and Liabilities Measured at Fair Value on a Nonrecurring Basis
At December 31 At December 31
Total Level 1 Level 2 Level 3
Before-Tax
Loss
Year 2011 Total Level 1 Level 2 Level 3
Before-Tax
Loss
Year 2010
Properties, plant and
equipment, net
(held and used) $ 67 $ – $ – $ 67 $ 81 $ 57 $ – $ – $ 57 $ 85
Properties, plant and
equipment, net
(held for sale) 167 – 167 – 54 13 – – 13 36
Investments and advances – – – – 108 – – – – 15
Total Nonrecurring
Assets at Fair Value $ 234 $ – $ 167 $ 67 $ 243 $ 70 $ – $ – $ 70 $ 136