Chevron 2011 Annual Report Download - page 54
Download and view the complete annual report
Please find page 54 of the 2011 Chevron annual report below. You can navigate through the pages in the report by either clicking on the pages listed below, or by using the keyword search tool below to find specific information within the annual report.-
 1
1 -
2
-
3
-
4
-
5
-
6
-
7
-
8
-
9
-
10
-
11
-
12
-
13
-
14
-
15
-
16
-
17
-
18
-
19
-
20
-
21
-
22
-
23
-
24
-
25
-
26
-
27
-
28
-
29
-
30
-
31
-
32
-
33
-
34
-
35
-
36
-
37
-
38
-
39
-
40
-
41
-
42
-
43
-
 44
44 -
 45
45 -
 46
46 -
 47
47 -
 48
48 -
 49
49 -
 50
50 -
 51
51 -
 52
52 -
 53
53 -
 54
54 -
 55
55 -
 56
56 -
 57
57 -
 58
58 -
 59
59 -
 60
60 -
 61
61 -
 62
62 -
 63
63 -
 64
64 -
65
-
66
-
67
-
68
-
69
-
70
-
71
-
72
-
73
-
74
-
75
-
76
-
77
-
78
-
79
-
80
-
81
-
82
-
83
-
84
-
85
-
86
-
87
-
88
-
89
-
90
-
91
-
92
 |
 |

52 Chevron Corporation 2011 Annual Report
Note 15 Taxes – Continued
Notes to the Consolidated Financial Statements
Millions of dollars, except per-share amounts
with before-tax income of $6,528 and $1,310 in 2010 and
2009, respectively. For international operations, before-tax
income was $37,412, $25,527 and $17,218 in 2011, 2010
and2009, respectively. U.S. federal income tax expense was
reduced by $191, $162 and $204 in 2011, 2010 and 2009,
respectively, for business tax credits.
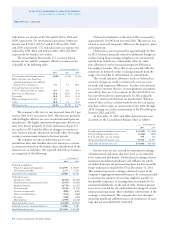
e reconciliation between the U.S. statutory federal
income tax rate and the company’s eective income tax rate
isdetailed in the following table:
Year ended December 31
2011 2010 2009
U.S. statutory federal income tax rate 35.0% 35.0% 35.0%
Eect of income taxes from inter-
national operations at rates dierent
from the U.S. statutory rate 7.5 5.2 10.4
State and local taxes on income, net
of U.S. federal income tax benet 0.9 0.8 0.9
Prior year tax adjustments (0.1) (0.6) (0.3)
Tax credits (0.4) (0.5) (1.1)
Eects of changes in tax rates 0.5 – 0.1
Other (0.1) 0.4 (2.0)
Eective tax rate 43.3% 40.3% 43.0%
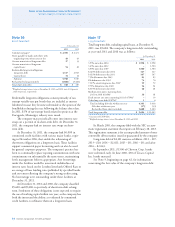
e company’s eective tax rate increased from 40.3 per-
cent in 2010 to 43.3 percent in 2011. is increase primarily
reected higher eective tax rates in international upstream
jurisdictions. e higher international upstream eective tax
rates were driven primarily by lower utilization of non-U.S.
tax credits in 2011 and the eect of changes in income tax
rates between periods, which were partially oset by foreign
currency remeasurement impacts between periods.
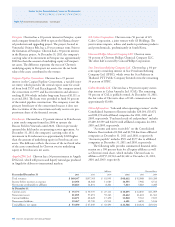
e company records its deferred taxes on a tax-
jurisdiction basis and classies those net amounts as current
or noncurrent based on the balance sheet classication of the
related assets or liabilities. e reported deferred tax balances
are composed of the following:
At December 31
2011 2010
Deferred tax liabilities
Properties, plant and equipment $ 23,597 $ 19,855
Investments and other 2,271 2,401
Total deferred tax liabilities 25,868 22,256
Deferred tax assets
Foreign tax credits (8,476) (6,669)
Abandonment/environmental reserves (5,387) (5,004)
Employee benets (4,773) (3,627)
Deferred credits (1,548) (2,176)
Tax loss carryforwards (828) (882)
Other accrued liabilities (531) (486)
Inventory (360) (483)
Miscellaneous (1,595) (1,676)
Total deferred tax assets (23,498) (21,003)
Deferred tax assets valuation allowance 11,096 9,185
Total deferred taxes, net $ 13,466 $ 10,438
Deferred tax liabilities at the end of 2011 increased by
approximately $3,600 from year-end 2010. e increase was
related to increased temporary dierences for property, plant
and equipment.
Deferred tax assets increased by approximately $2,500
in 2011. Increases primarily related to additional foreign tax
credits arising from earnings in high-tax-rate international
jurisdictions (which were substantially oset by valua-
tion allowances) and to increased temporary dierences
for employee benets. ese eects were partially oset by
reductions in deferred credits resulting primarily from the
usage of tax benets in international tax jurisdictions.
e overall valuation allowance relates to deferred tax
assets for foreign tax credit carryforwards, tax loss carry-
forwards and temporary dierences. It reduces the deferred
tax assets to amounts that are, in management’s assessment,
more likely than not to be realized. At the end of 2011, tax
loss carryforwards were approximately $2,160, primarily
related to various international tax jurisdictions. Whereas
some of these tax loss carryforwards do not have an expira-
tion date, others expire at various times from 2012 through
2036. Foreign tax credit carryforwards of $8,476 will expire
between 2012 and 2021.
At December 31, 2011 and 2010, deferred taxes were
classied on the Consolidated Balance Sheet as follows:
At December 31
2011 2010
Prepaid expenses and other current assets $ (1,149) $ (1,624)
Deferred charges and other assets (1,224) (851)
Federal and other taxes on income 295 216
Noncurrent deferred income taxes 15,544 12,697
Total deferred income taxes, net $ 13,466 $ 10,438
Income taxes are not accrued for unremitted earnings
of international operations that have been or are intended
to be reinvested indenitely. Undistributed earnings of inter-
national consolidated subsidiaries and affiliates for which
no deferred income tax provision has been made for possible
future remittances totaled $24,376 at December 31, 2011.
is amount represents earnings reinvested as part of the
company’s ongoing international business. It is not practicable
to estimate the amount of taxes that might be payable on
the possible remittance of earnings that are intended to be
reinvested indenitely. At the end of 2011, deferred income
taxes were recorded for the undistributed earnings of certain
international operations where indenite reinvestment of the
earnings is not planned. e company does not anticipate
incurring signicant additional taxes on remittances of earn-
ings that are not indenitely reinvested.