Chevron 2011 Annual Report Download - page 23
Download and view the complete annual report
Please find page 23 of the 2011 Chevron annual report below. You can navigate through the pages in the report by either clicking on the pages listed below, or by using the keyword search tool below to find specific information within the annual report.-
 1
1 -
2
-
3
-
4
-
5
-
6
-
7
-
8
-
9
-
10
-
11
-
12
-
 13
13 -
 14
14 -
 15
15 -
 16
16 -
 17
17 -
 18
18 -
 19
19 -
 20
20 -
 21
21 -
 22
22 -
 23
23 -
 24
24 -
 25
25 -
 26
26 -
 27
27 -
 28
28 -
 29
29 -
 30
30 -
 31
31 -
 32
32 -
 33
33 -
34
-
35
-
36
-
37
-
38
-
39
-
40
-
41
-
42
-
43
-
44
-
45
-
46
-
47
-
48
-
49
-
50
-
51
-
52
-
53
-
54
-
55
-
56
-
57
-
58
-
59
-
60
-
61
-
62
-
63
-
64
-
65
-
66
-
67
-
68
-
69
-
70
-
71
-
72
-
73
-
74
-
75
-
76
-
77
-
78
-
79
-
80
-
81
-
82
-
83
-
84
-
85
-
86
-
87
-
88
-
89
-
90
-
91
-
92
 |
 |

Chevron Corporation 2011 Annual Report 21
chase, sale and storage of crude oil, rened products, natural
gas, natural gas liquids and feedstock for company reneries.
e company also uses derivative commodity instruments for
limited trading purposes. e results of these activities were
not material to the company’s nancial position, results of
operations or cash ows in 2011.
e company’s market exposure positions are monitored
and managed on a daily basis by an internal Risk Control
group in accordance with the company’s risk management
policies, which have been approved by the Audit Committee
of the company’s Board of Directors.
e derivative commodity instruments used in the
company’s risk management and trading activities consist
mainly of futures, options and swap contracts traded on the
New York Mercantile Exchange and on electronic platforms
of the Inter-Continental Exchange and Chicago Mercantile
Exchange. In addition, crude oil, natural gas and rened
product swap contracts and option contracts are entered into
principally with major nancial institutions and other oil and
gas companies in the “over-the-counter” markets.
Derivatives beyond those designated as normal purchase
and normal sale contracts are recorded at fair value on the
Consolidated Balance Sheet in accordance with accounting
standards for derivatives (ASC 815), with resulting gains and
losses reected in income. Fair values are derived principally
from published market quotes and other independent third-
party quotes. e change in fair value of Chevron’s derivative
commodity instruments in 2011 was a quarterly average
increase of $22 million in total assets and a quarterly average
decrease of $17 million in total liabilities.
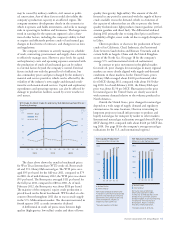
e company uses a Value-at-Risk (VaR) model to esti-
mate the potential loss in fair value on a single day from the
eect of adverse changes in market conditions on derivative
commodity instruments held or issued. VaR is the maximum
projected loss not to be exceeded within a given probability
or condence level over a given period of time. e compa-
ny’s VaR model uses the Monte Carlo simulation method
that involves generating hypothetical scenarios from the
specied probability distributions and constructing a full
distribution of a portfolio’s potential values.
e VaR model utilizes an exponentially weighted
moving average for computing historical volatilities and
correlations, a 95 percent condence level, and a one-day
holding period. at is, the company’s 95 percent, one-day
VaR corresponds to the unrealized loss in portfolio value that
would not be exceeded on average more than one in every 20
trading days, if the portfolio were held constant for one day.
e one-day holding period is based on the assumption
that market-risk positions can be liquidated or hedged within
one day. For hedging and risk management, the company
uses conventional exchange-traded instruments such as
futures and options as well as non-exchange-traded swaps,
most of which can be liquidated or hedged eectively within
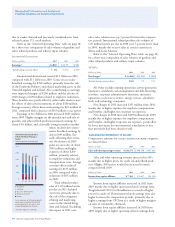
one day. e following table presents the 95 percent/one-day
VaR for each of the company’s primary risk exposures in the
area of derivative commodity instruments at December 31,
2011 and 2010.
nancing arrangements. e agreements typically provide
goods and services, such as pipeline and storage capacity,
drilling rigs, utilities, and petroleum products, to be used
orsold in the ordinary course of the company’s business.
eaggregate approximate amounts of required payments
under these various commitments are: 2012 – $6.0billion;
2013 – $4.0 billion; 2014 – $3.9 billion; 2015 – $3.2 billion;
2016 – $1.9billion; 2017 and after – $7.4billion. A por-
tion of these commitments may ultimately be shared with
project partners. Total payments under the agreements were
approximately $6.6 billion in 2011, $6.5 billion in 2010 and
$8.1 billion in 2009.
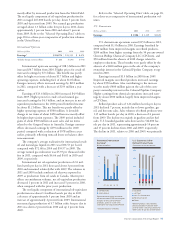
e following table summarizes the company’s signi-
cant contractual obligations:
Contractual Obligations1
Millions of dollars Payments Due by Period
2013– 2015– After
Total 2012 2014 2016 2016
On Balance Sheet:2
Short-Term Debt3 $ 340 $ 340 $ – $ – $ –
Long-Term Debt3 9,684 – 7,641 – 2,043
Noncancelable Capital
Lease Obligations 251 70 79 34 68
Interest 1,764 223 366 264 911
O Balance Sheet:
Noncancelable Operating
Lease Obligations 3,509 693 1,155 868 793
roughput and
Take-or-Pay Agreements4 21,664 4,912 5,382 4,218 7,152
Other Unconditional
Purchase Obligations4 4,759 1,102 2,524 906 227
1 Excludes contributions for pensions and other postretirement benet plans. Information
on employee benet plans is contained in Note 21 beginning on page 57.
2 Does not include amounts related to the company’s income tax liabilities associated with
uncertain tax positions. e company is unable to make reasonable estimates for the
periods in which these liabilities may become payable. e company does not expect
settlement of such liabilities will have a material eect on its results of operations, consol-
idated nancial position or liquidity in any single period.
3 $5.6 billion of short-term debt that the company expects to renance is included in long-
term debt. e repayment schedule above reects the projected repayment of the entire
amounts in the 2013–2014 period.
4 Does not include commodity purchase obligations that are not xed or determinable.
ese obligations are generally monetized in a relatively short period of time through
sales transactions or similar agreements with third parties. Examples include obligations
to purchase LNG, regasied natural gas and renery products at indexed prices.
Financial and Derivative Instruments
e market risk associated with the company’s portfolio of
nancial and derivative instruments is discussed below. e
estimates of nancial exposure to market risk do not rep-
resent the company’s projection of future market changes.
e actual impact of future market changes could dier
materially due to factors discussed elsewhere in this report,
including those set forth under the heading “Risk Factors”
in Part I, Item 1A, of the company’s 2011 Annual Report on
Form 10-K.
Derivative Commodity Instruments Chevron is exposed
to market risks related to the price volatility of crude oil,
rened products, natural gas, natural gas liquids, liqueed
natural gas and renery feedstocks.
e company uses derivative commodity instruments to
manage these exposures on a portion of its activity, including
rm commitments and anticipated transactions for the pur-