Chevron 2011 Annual Report Download - page 73
Download and view the complete annual report
Please find page 73 of the 2011 Chevron annual report below. You can navigate through the pages in the report by either clicking on the pages listed below, or by using the keyword search tool below to find specific information within the annual report.-
 1
1 -
2
-
3
-
4
-
5
-
6
-
7
-
8
-
9
-
10
-
11
-
12
-
13
-
14
-
15
-
16
-
17
-
18
-
19
-
20
-
21
-
22
-
23
-
24
-
25
-
26
-
27
-
28
-
29
-
30
-
31
-
32
-
33
-
34
-
35
-
36
-
37
-
38
-
39
-
40
-
41
-
42
-
43
-
44
-
45
-
46
-
47
-
48
-
49
-
50
-
51
-
52
-
53
-
54
-
55
-
56
-
57
-
58
-
59
-
60
-
61
-
62
-
 63
63 -
 64
64 -
 65
65 -
 66
66 -
 67
67 -
 68
68 -
 69
69 -
 70
70 -
 71
71 -
 72
72 -
 73
73 -
 74
74 -
 75
75 -
 76
76 -
 77
77 -
 78
78 -
 79
79 -
 80
80 -
 81
81 -
 82
82 -
 83
83 -
84
-
85
-
86
-
87
-
88
-
89
-
90
-
91
-
92
 |
 |

Chevron Corporation 2011 Annual Report 71
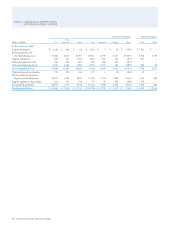
Table II – Capitalized Costs Related to Oil and Gas Producing Activities
Consolidated Companies Aliated Companies
Other
Millions of dollars U.S. Americas Africa Asia Australia Europe Total TCO Other
At December 31, 2011
Unproved properties $ 9,806 $ 1,417 $ 368 $ 2,408 $ 6 $ 33 $ 14,038 $ 109 $ –
Proved properties and
related producing assets 57,674 11,029 25,549 36,740 2,244 9,549 142,785 6,583 1,607
Support equipment 1,071 292 1,362 1,544 533 169 4,971 1,018 –
Deferred exploratory wells 565 63 629 260 709 208 2,434 – –
Other uncompleted projects 4,887 2,408 4,773 3,109 6,076 492 21,745 605 1,466
Gross Capitalized Costs 74,003 15,209 32,681 44,061 9,568 10,451 185,973 8,315 3,073
Unproved properties valuation 1,085 498 178 262 2 13 2,038 38 –
Proved producing properties –
Depreciation and depletion 39,210 4,826 13,173 20,991 1,574 7,742 87,516 1,910 436
Support equipment depreciation 530 175 715 1,192 238 129 2,979 451 –
Accumulated provisions 40,825 5,499 14,066 22,445 1,814 7,884 92,533 2,399 436
Net Capitalized Costs $ 33,178 $ 9,710 $ 18,615 $ 21,616 $ 7,754 $ 2,567 $ 93,440 $ 5,916 $ 2,637
At December 31, 2010
Unproved properties $ 2,553 $ 1,349 $ 359 $ 2,561 $ 6 $ 8 $ 6,836 $ 108 $ –
Proved properties and
related producing assets 55,601 7,747 23,683 33,316 2,585 9,035 131,967 6,512 1,594
Support equipment 975 265 1,282 1,421 259 165 4,367 985 –
Deferred exploratory wells 743 210 611 224 732 198 2,718 – –
Other uncompleted projects 2,299 3,844 4,061 3,627 3,631 362 17,824 357 1,001
Gross Capitalized Costs 62,171 13,415 29,996 41,149 7,213 9,768 163,712 7,962 2,595
Unproved properties valuation 967 436 150 200 2 – 1,755 34 –
Proved producing properties –
Depreciation and depletion 37,682 3,986 10,986 18,197 1,718 7,162 79,731 1,530 249
Support equipment depreciation 518 153 600 1,126 84 114 2,595 402 –
Accumulated provisions 39,167 4,575 11,736 19,523 1,804 7,276 84,081 1,966 249
Net Capitalized Costs $ 23,004 $ 8,840 $ 18,260 $ 21,626 $ 5,409 $ 2,492 $ 79,631 $ 5,996 $ 2,346
the company’s estimated net proved-reserve quantities,
stan dardized measure of estimated discounted future
netcash ows related to proved reserves, and changes in
estimated discounted future net cash ows. e Africa
geographic area includes activities principally in Angola,
Chad, Democratic Republic of the Congo, Nigeria, and
Republic ofthe Congo. e Asia geographic area includes
activities principally in Azerbaijan, Bangladesh, China,
Indonesia, Kazakhstan, Myanmar, the Partitioned Zone
between Kuwait and Saudi Arabia, the Philippines and
ailand. e Europe geographic area includes activity
in Denmark, the Netherlands, Norway and the United
Kingdom. e Other Americas geographic region includes
activities in Argentina, Brazil, Canada, Colombia, and
Trinidad and Tobago. Amounts for TCO repre sent
Chevron’s 50percent equity share of Tengizchevroil, an
exploration and production partnership in the Republic of
Kazakhstan. e aliated companies Other amounts are
composed of the company’s equity interests in Venezuela and
Angola. Refer to Note 12, beginning on page 47, for a dis-
cussion of thecompany’s major equity aliates.
Table II Capitalized Costs Related to Oil and
Gas Producing Activities