Chevron 2011 Annual Report Download - page 46
Download and view the complete annual report
Please find page 46 of the 2011 Chevron annual report below. You can navigate through the pages in the report by either clicking on the pages listed below, or by using the keyword search tool below to find specific information within the annual report.-
 1
1 -
2
-
3
-
4
-
5
-
6
-
7
-
8
-
9
-
10
-
11
-
12
-
13
-
14
-
15
-
16
-
17
-
18
-
19
-
20
-
21
-
22
-
23
-
24
-
25
-
26
-
27
-
28
-
29
-
30
-
31
-
32
-
33
-
34
-
35
-
 36
36 -
 37
37 -
 38
38 -
 39
39 -
 40
40 -
 41
41 -
 42
42 -
 43
43 -
 44
44 -
 45
45 -
 46
46 -
 47
47 -
 48
48 -
 49
49 -
 50
50 -
 51
51 -
 52
52 -
 53
53 -
 54
54 -
 55
55 -
 56
56 -
57
-
58
-
59
-
60
-
61
-
62
-
63
-
64
-
65
-
66
-
67
-
68
-
69
-
70
-
71
-
72
-
73
-
74
-
75
-
76
-
77
-
78
-
79
-
80
-
81
-
82
-
83
-
84
-
85
-
86
-
87
-
88
-
89
-
90
-
91
-
92
 |
 |

44 Chevron Corporation 2011 Annual Report
Notes to the Consolidated Financial Statements
Millions of dollars, except per-share amounts
Note 10
Financial and Derivative Instruments
Derivative Commodity Instruments Chevron is exposed
to market risks related to price volatility of crude oil, rened
products, natural gas, natural gas liquids, liqueed natural gas
and renery feedstocks.
e company uses derivative commodity instruments to
manage these exposures on a portion of its activity, including
rm commitments and anticipated transactions for the pur-
chase, sale and storage of crude oil, rened products, natural
gas, natural gas liquids and feedstock for company reneries.
From time to time, the company also uses derivative commod-
ity instruments for limited trading purposes.
e company’s derivative commodity instruments princi-
pally include crude oil, natural gas and rened product futures,
swaps, options, and forward contracts. None of the company’s
derivative instruments is designated as a hedging instrument,
although certain of the company’s aliates make such des-
ignation. e company’s derivatives are not material to the
company’s nancial position, results of operations or liquidity.
e company believes it has no material market or credit risks
to its operations, nancial position or liquidity as a result of its
commodity derivative activities.
e company uses Inter national Swaps and Derivatives
Association agreements to govern derivative contracts with cer-
tain counterparties to mitigate credit risk. Depending on the
nature of the derivative transactions, bilateral collateral arrange-
ments may also be required. When the company is engaged in
more than one outstanding derivative transaction with the same
counterparty and also has a legally enforceable netting agree-
ment with that counterparty, the net mark-to-market exposure
represents the netting of the positive and negative exposures
with that counterparty and is a reasonable measure of the com-
pany’s credit risk exposure. e company also uses other netting
agreements with certain counterparties with which it conducts
signicant transactions to mitigate credit risk.
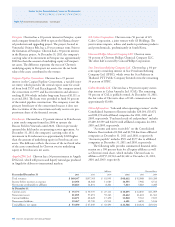
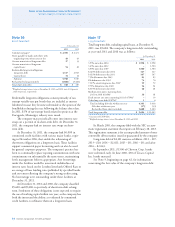
Derivative instruments measured at fair value at Decem-
ber 31, 2011, December 31, 2010, and December 31, 2009,
and their classication on the Consolidated Balance Sheet and
Consolidated Statement of Income are as follows:
Consolidated Balance Sheet: Fair Value of Derivatives Not
Designated as Hedging Instruments
Balance Sheet At December 31 At December 31
Type of Contract Classication 2011 2010
Commodity Accounts and
notes receivable, net $ 133 $ 58
Commodity Long-term
receivables, net 75 64
Total Assets at Fair Value $ 208 $ 122
Commodity Accounts payable $ 36 $ 131
Commodity Deferred credits and other
noncurrent obligations 66 40
Total Liabilities at Fair Value $ 102 $ 171
Consolidated Statement of Income: e Eect of Derivatives Not
Designated as Hedging Instruments
Gain/(Loss)
Type of Derivative Statement of Year ended December 31
Contract Income Classication 2011 2010 2009
Foreign Exchange Other income $ – $ – $ 26
Commodity Sales and other
operating revenues (255) (98) (94)
Commodity Purchased crude oil
and products 15 (36) (353)
Commodity Other income (2) (1) –
$ (242) $ (135) $ (421)
Foreign Currency e company may enter into currency
derivative contracts to manage some of its foreign currency
exposures. ese exposures include revenue and anticipated
purchase transactions, including foreign currency capital
expenditures and lease commitments. e currency deriva-
tive contracts, if any, are recorded at fair value on the balance
sheet with resulting gains and losses reected in income.
ere were no open currency derivative contracts at Decem-
ber 31, 2011 or 2010.
Interest Rates e company may enter into interest rate swaps
from time to time as part of its overall strategy to manage the
interest rate risk on its debt. Interest rate swaps related to a
portion of the company’s xed-rate debt, if any, may be
accounted for as fair value hedges. Interest rate swaps related
to oating-rate debt, if any, are recorded at fair value on the
balance sheet with resulting gains and losses reected in
income. At year-end 2011 and 2010, the company had no
interest rate swaps.