Chevron 2011 Annual Report Download - page 18
Download and view the complete annual report
Please find page 18 of the 2011 Chevron annual report below. You can navigate through the pages in the report by either clicking on the pages listed below, or by using the keyword search tool below to find specific information within the annual report.-
 1
1 -
2
-
3
-
4
-
5
-
6
-
7
-
 8
8 -
 9
9 -
 10
10 -
 11
11 -
 12
12 -
 13
13 -
 14
14 -
 15
15 -
 16
16 -
 17
17 -
 18
18 -
 19
19 -
 20
20 -
 21
21 -
 22
22 -
 23
23 -
 24
24 -
 25
25 -
 26
26 -
 27
27 -
 28
28 -
29
-
30
-
31
-
32
-
33
-
34
-
35
-
36
-
37
-
38
-
39
-
40
-
41
-
42
-
43
-
44
-
45
-
46
-
47
-
48
-
49
-
50
-
51
-
52
-
53
-
54
-
55
-
56
-
57
-
58
-
59
-
60
-
61
-
62
-
63
-
64
-
65
-
66
-
67
-
68
-
69
-
70
-
71
-
72
-
73
-
74
-
75
-
76
-
77
-
78
-
79
-
80
-
81
-
82
-
83
-
84
-
85
-
86
-
87
-
88
-
89
-
90
-
91
-
92
 |
 |

Management’s Discussion and Analysis of
Financial Condition and Results of Operations
16 Chevron Corporation 2011 Annual Report
Management’s Discussion and Analysis of
Financial Condition and Results of Operations
due to weaker demand and previously completed exits from
selected eastern U.S. retail markets.
Refer to the “Selected Operating Data” table on page 18
for a three-year comparison of sales volumes of gasoline and
other rened products and renery input volumes.
International Downstream
Millions of dollars 2011 2010 2009
Earnings* $ 2,085 $ 1,139 $ 594
*Includes foreign currency eects: $ (65) $ (135) $ (191)
International downstream earned $2.1 billion in 2011,
compared with $1.1 billion in 2010. Gains on asset sales
beneted earnings by $700 million, primarily from the sale
of the Pembroke Renery and related marketing assets in the
United Kingdom and Ireland. Also contributing to earnings
were improved margins of $200 million and the absence of
2010 charges of $90 million related to employee reductions.
ese benets were partly oset by unfavorable mark-to-mar-
ket eects of derivative instruments of about $180 million.
Foreign currency eects decreased earnings by $65 million in
2011, compared with a decrease of $135 million a year earlier.
Earnings of $1.1 billion in 2010 increased $545 million
from 2009. Higher margins on the manufacture and sale of
gasoline and other rened products increased earnings by
about $1.0 billion, and a favorable swing in mark-to-market
eects on derivative instru-
ments beneted earnings by
about $300 million. Par-
tially osetting these items
was the absence of 2009
gains on asset sales of about
$550 million and higher
expenses of about $200
million, primarily related
to employee reductions and
transportation costs. Foreign
currency eects reduced
earnings by $135 million
in 2010, compared with a
reduction of $191 million
in 2009.
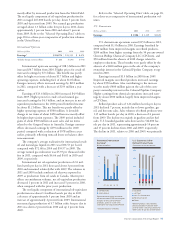
Total rened product
sales of 1.69 million barrels
per day in 2011 declined
4 percent, primarily due to
the sale of the company’s
rening and marketing
assets in the United King-
dom and Ireland. Excluding
the impact of 2011 asset
sales, sales volumes were up 3 percent between the compara-
tive periods. International rened product sales volumes of
1.76 million barrels per day in 2010 were 5 percent lower than
in 2009, mainly due to asset sales in certain countries in
Africa and Latin America.
Refer to the “Selected Operating Data” table, on page 18,
for a three-year comparison of sales volumes of gasoline and
other rened products and renery input volumes.
All Other
Millions of dollars 2011 2010 2009
Net charges* $ (1,482) $ (1,131) $ (922)
*Includes foreign currency eects: $ (25) $ 5 $ 25
All Other includes mining operations, power generation
businesses, worldwide cash management and debt nancing
activities, corporate administrative functions, insurance
operations, real estate activities, energy services, alternative
fuels, and technology companies.
Net charges in 2011 increased $351 million from 2010,
mainly due to higher expenses for employee compensation
and benets, and higher net corporate tax expenses.
Net charges in 2010 increased $209 million from 2009,
mainly due to higher expenses for employee compensation
and benets, and higher corporate tax expenses, partly oset
by lower provisions for environmental remediation at sites
that previously had been closed or sold.
Consolidated Statement of Income
Comparative amounts for certain income statement categories
are shown below:
Millions of dollars 2011 2010 2009
Sales and other operating revenues $ 244,371 $ 198,198 $ 167,402
Sales and other operating revenues increased in 2011,
mainly due to higher prices for crude oil and rened prod-
ucts. Higher 2010 prices resulted in increased revenues
compared with 2009.
Millions of dollars 2011 2010 2009
Income from equity aliates $ 7,363 $ 5,637 $ 3,316
Income from equity aliates increased in 2011 from
2010 mainly due to higher upstream-related earnings from
Tengizchevroil (TCO) in Kazakhstan as a result of higher
prices for crude oil. Downstream-related earnings were also
higher between the comparative periods, primarily due to
higher earnings from CPChem as a result of higher margins
on sales of commodity chemicals.
Income from equity aliates increased in 2010 from
2009 largely due to higher upstream-related earnings from
0
2500
2000
1500
1000
500
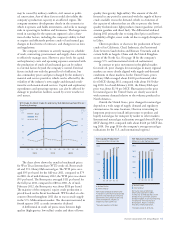
International Gasoline &
Other Refined Product
Sales*
Thousands of barrels per day
Sales volumes of refined products
were down 4 percent from 2010
mainly due to asset sales in the
United Kingdom and Ireland.
*Includes equity in affiliates.
Gasoline
Jet Fuel
Gas Oils & Kerosene
Residual Fuel Oil
Other
0807 09 10 11
1,692