Chevron 2011 Annual Report Download - page 80
Download and view the complete annual report
Please find page 80 of the 2011 Chevron annual report below. You can navigate through the pages in the report by either clicking on the pages listed below, or by using the keyword search tool below to find specific information within the annual report.-
 1
1 -
2
-
3
-
4
-
5
-
6
-
7
-
8
-
9
-
10
-
11
-
12
-
13
-
14
-
15
-
16
-
17
-
18
-
19
-
20
-
21
-
22
-
23
-
24
-
25
-
26
-
27
-
28
-
29
-
30
-
31
-
32
-
33
-
34
-
35
-
36
-
37
-
38
-
39
-
40
-
41
-
42
-
43
-
44
-
45
-
46
-
47
-
48
-
49
-
50
-
51
-
52
-
53
-
54
-
55
-
56
-
57
-
58
-
59
-
60
-
61
-
62
-
63
-
64
-
65
-
66
-
67
-
68
-
69
-
 70
70 -
 71
71 -
 72
72 -
 73
73 -
 74
74 -
 75
75 -
 76
76 -
 77
77 -
 78
78 -
 79
79 -
 80
80 -
 81
81 -
 82
82 -
 83
83 -
 84
84 -
 85
85 -
 86
86 -
 87
87 -
 88
88 -
 89
89 -
 90
90 -
91
-
92
 |
 |

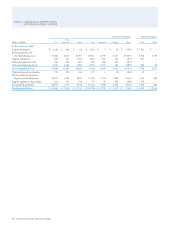
Table V Reserve Quantity Information – Continued
the ratio of proved undeveloped reserves to total proved
reserves has ranged between 37 percent and 44 percent. e
consistent completion of major capital projects has kept the
ratio in a narrow range over this time period.
Proved Reserve Quantities At December 31, 2011, proved
reserves for the company’s consolidated operations were
8.5billion BOE. (Refer to the term “Reserves” on page 8
for the denition of oil-equivalent reserves.) Approximately
23 percent of the total reserves were located in the United
States. For the company’s interests in equity aliates, proved
reserves were 2.7 billion BOE, 78percent of which were asso-
ciated with the company’s 50percent ownership in TCO.
Aside from the Tengiz Field in the TCO aliate, no
single property accounted for more than 5 percent of the
company’s total oil-equivalent proved reserves. About 22
other individual properties in the company’s portfolio of
assets each contained between 1 percent and 5 percent of
the company’s oil-equivalent proved reserves, which in the
aggregate accounted for 47 percent of the company’s total
oil-equivalent proved reserves. ese properties were geo-
graphically dispersed, located in the United States, Canada,
South America, Africa, Asia and Australia.
In the United States, total proved reserves at year-end
2011 were 1.9 billion BOE. California properties accounted
for 35 percent of the U.S. reserves, with most classied as
heavy oil. Because of heavy oil’s high viscosity and the need
to employ enhanced recovery methods, most of the com-
pany’s heavy-oil elds in California employ a continuous
steamooding process. e Gulf of Mexico region contains
24 percent of the U.S. reserves, with liquids represent-
ing about 77 percent of reserves in the Gulf. Production
operations are mostly oshore and, as a result, are also
capital intensive. Other U.S. areas represent the remaining
41 percent of U.S. reserves, with liquids accounting for about
42 percent of the total. For production of crude oil, some
elds utilize enhanced recovery methods, including water-
ood and CO2 injection.
For the three years ending December 31, 2011, the pat-
tern of net reserve changes shown in the following tables are
not necessarily indicative of future trends. Apart from acqui-
sitions, the company’s ability to add proved reserves is
aected by, among other things, events and circumstances
that are outside the company’s control, such as delays in gov-
ernment permitting, partner approvals of development plans,
changes in oil and gas prices, OPEC constraints, geopolitical
uncertainties, and civil unrest.
e company’s estimated net proved reserves of crude
oil, condensate, natural gas liquids and synthetic oil and
changes thereto for the years 2009, 2010 and 2011 are shown
in the table on the following page. e company’s estimated
net proved reserves of natural gas are shown on page 81.
78 Chevron Corporation 2011 Annual Report