Chevron 2011 Annual Report Download - page 14
Download and view the complete annual report
Please find page 14 of the 2011 Chevron annual report below. You can navigate through the pages in the report by either clicking on the pages listed below, or by using the keyword search tool below to find specific information within the annual report.-
 1
1 -
2
-
3
-
 4
4 -
 5
5 -
 6
6 -
 7
7 -
 8
8 -
 9
9 -
 10
10 -
 11
11 -
 12
12 -
 13
13 -
 14
14 -
 15
15 -
 16
16 -
 17
17 -
 18
18 -
 19
19 -
 20
20 -
 21
21 -
 22
22 -
 23
23 -
 24
24 -
25
-
26
-
27
-
28
-
29
-
30
-
31
-
32
-
33
-
34
-
35
-
36
-
37
-
38
-
39
-
40
-
41
-
42
-
43
-
44
-
45
-
46
-
47
-
48
-
49
-
50
-
51
-
52
-
53
-
54
-
55
-
56
-
57
-
58
-
59
-
60
-
61
-
62
-
63
-
64
-
65
-
66
-
67
-
68
-
69
-
70
-
71
-
72
-
73
-
74
-
75
-
76
-
77
-
78
-
79
-
80
-
81
-
82
-
83
-
84
-
85
-
86
-
87
-
88
-
89
-
90
-
91
-
92
 |
 |

Management’s Discussion and Analysis of
Financial Condition and Results of Operations
12 Chevron Corporation 2011 Annual Report
Management’s Discussion and Analysis of
Financial Condition and Results of Operations
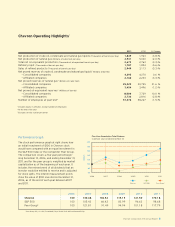
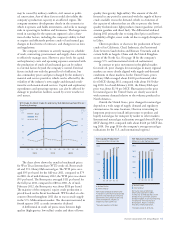
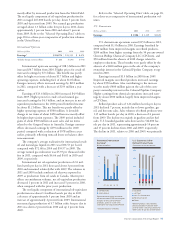
e company’s worldwide net oil-equivalent production
in 2011 averaged 2.673 million barrels per day. About one-
fth of the company’s net oil-equivalent production in 2011
occurred in the OPEC-member countries of Angola, Nigeria,
Venezuela and the Partitioned Zone between Saudi Arabia
and Kuwait. OPEC quotas had no eect on the company’s
net crude oil production in 2011 or 2010. At their December
2011 meeting, members of OPEC supported maintaining
the current production level of 30 million barrels per day
and made no change to the production quotas in eect since
December 2008.
e company estimates that oil-equivalent production
in 2012 will average approximately 2.680 million barrels per
day based on the average Brent price of $111 per barrel for
the full-year 2011. is estimate is subject to many factors
and uncertainties, including quotas that may be imposed
by OPEC, price eects on entitlement volumes, changes in
scal terms or restrictions on the scope of company opera-
tions, delays in project startups, uctuations in demand for
natural gas in various markets, weather conditions that may
shut in production, civil unrest, changing geopolitics, delays
in completion of maintenance turnarounds, greater-than-
expected declines in production from mature elds, or other
disruptions to operations. e outlook for future production
levels is also aected by the size and number of economic
investment opportunities and, for new large-scale projects, the
time lag between initial exploration and the beginning of pro-
duction. Investments in upstream projects generally begin well
in advance of the start of the associated crude oil and natural
gas production. A signicant majority of Chevron’s upstream
investment is made outside the United States.
Refer to the “Results of Operations” section on pages
14 through 15 for additional discussion of the company’s
upstream business.
Refer to Table V beginning on page 75 for a tabulation of
the company’s proved net oil and gas reserves by geographic
area at the beginning of 2009 and each year-end from 2009
through 2011, and an accompanying discussion of major
changes to proved reserves by geographic area for the three-
year period ending December 31, 2011.
In early November 2011, while drilling a development
well in the deepwater Frade Field in Brazil, an unantici-
pated pressure spike caused oil to migrate from the well
bore through a series of ssures to the sea oor, emitting
approximately 2,400 barrels of oil. e resulting surface
sheen has since dissipated, and there have been no coastal or
wildlife impacts. Upon detection, the company immediately
took steps to stop the release. Chevron’s emergency plan,
approved by the Brazilian environment and natural resources
regulatory agency IBAMA, was implemented according to
the law and industry standards. e source of the seep was
contained within four days. As of December 31, 2011, the
nancial impact of the incident was not material to the com-
pany’s annual net income. However, the company’s ultimate
exposure related to nes and penalties is not currently deter-
minable, and could be signicant to net income in any one
period.
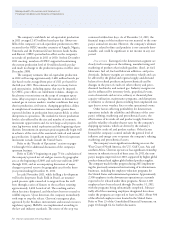
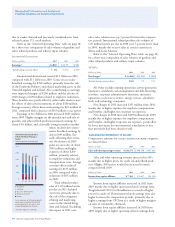
Downstream Earnings for the downstream segment are
closely tied to margins on the rening, manufacturing and
marketing of products that include gasoline, diesel, jet fuel,
lubricants, fuel oil, fuel and lubricant additives, and petro-
chemicals. Industry margins are sometimes volatile and can
be aected by the global and regional supply-and-demand
balance for rened products and petrochemicals and by
changes in the price of crude oil, other renery and petro-
chemical feedstocks, and natural gas. Industry margins can
also be inuenced by inventory levels, geopolitical events,
costs of materials and services, renery or chemical plant
capacity utilization, maintenance programs, and disruptions
at reneries or chemical plants resulting from unplanned out-
ages due to severe weather, res or other operational events.
Other factors aecting protability for downstream
operations include the reliability and eciency of the com-
pany’s rening, marketing and petrochemical assets, the
eectiveness of its crude oil and product supply functions,
and the volatility of tanker-charter rates for the company’s
shipping operations, which are driven by the industry’s
demand for crude oil and product tankers. Other factors
beyond the company’s control include the general level of
ination and energy costs to operate the company’s rening,
marketing and petrochemical assets.
e company’s most signicant marketing areas are the
West Coast of North America, the U.S. Gulf Coast, Asia and
southern Africa. Chevron operates or has signicant ownership
interests in reneries in each of these areas. In 2011, the com-
pany’s margins improved over 2010, supported by higher global
product demand and tighter global rened product supplies.
e company made further progress during 2011 implement-
ing the previously announced restructuring of its downstream
businesses, including the employee-reduction programs for
the United States and international operations. Approximately
2,300 employees in the downstream operations are currently
expected to be released under these programs. About 2,100
employees have been released through December 31, 2011,
with the programs being substantially completed. Substan-
tially all of the remaining employees designated for release
under the programs are expected to leave in 2012. About 900
of the aected employees were located in the United States.
Refer to Note 23 of the Consolidated Financial Statements, on
pages 63 through 64, for further discussion.