Chevron 2011 Annual Report Download - page 82
Download and view the complete annual report
Please find page 82 of the 2011 Chevron annual report below. You can navigate through the pages in the report by either clicking on the pages listed below, or by using the keyword search tool below to find specific information within the annual report.-
 1
1 -
2
-
3
-
4
-
5
-
6
-
7
-
8
-
9
-
10
-
11
-
12
-
13
-
14
-
15
-
16
-
17
-
18
-
19
-
20
-
21
-
22
-
23
-
24
-
25
-
26
-
27
-
28
-
29
-
30
-
31
-
32
-
33
-
34
-
35
-
36
-
37
-
38
-
39
-
40
-
41
-
42
-
43
-
44
-
45
-
46
-
47
-
48
-
49
-
50
-
51
-
52
-
53
-
54
-
55
-
56
-
57
-
58
-
59
-
60
-
61
-
62
-
63
-
64
-
65
-
66
-
67
-
68
-
69
-
70
-
71
-
 72
72 -
 73
73 -
 74
74 -
 75
75 -
 76
76 -
 77
77 -
 78
78 -
 79
79 -
 80
80 -
 81
81 -
 82
82 -
 83
83 -
 84
84 -
 85
85 -
 86
86 -
 87
87 -
 88
88 -
 89
89 -
 90
90 -
 91
91 -
 92
92
 |
 |

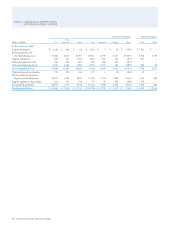
Table V Reserve Quantity Information – Continued
In 2011, net revisions increased reserves 197 million
barrels for consolidated companies and increased reserves
38 million barrels for aliated companies. For consolidated
companies, improved reservoir performance accounted for
a majority of the 63 million barrel increase in the United
States. In Africa, improved eld performance drove the
60 million barrel increase. In Asia, increases from improved
reservoir performance were partially oset by the eects of
higher prices on production-sharing contracts. Synthetic oil
reserves in Canada increased by 32 million barrels, primar-
ily due to geotechnical revisions. For aliated companies,
improved facility and reservoir performance was partially
oset by the price eect on royalty determination at TCO.
Continued development drilling increased reserves in
Venezuela.
Improved Recovery In 2009, improved recovery increased
liquids volumes by 86 million barrels worldwide. Consoli-
dated companies accounted for 50 million barrels. e largest
addition was related to improved secondary recovery in
Nigeria. Aliated companies increased reserves 36 million
barrels due to improvements related to the TCO Sour Gas
Injection/Second Generation Plant (SGI/SGP) facilities.
In 2010, improved recovery increased volumes by
77 million barrels worldwide. For consolidated companies,
reserves in Africa increased 58 million barrels due primarily
to secondary recovery performance in Nigeria. Reserves in the
United States increased 11 million, primarily in California.
Aliated companies increased reserves 3 million barrels.
In 2011, improved recovery increased volumes by
58 million barrels worldwide. For consolidated companies,
reserves in Africa increased 48 million barrels due primar-
ily to secondary recovery performance in Nigeria. Reserves
in the United States increased by 6 million, primarily in
California. Other Americas increased 4 million barrels.
Extensions and Discoveries In 2009, extensions and
discoveries increased liquids volumes by 52 million barrels
worldwide. e largest additions were 20 million barrels
in Australia related to the Gorgon Project and 13 million
barrels in Other Americas related to delineation drilling
in Argentina. Africa and the United States accounted for
10 million barrels and 6 million barrels, respectively.
In 2010, extensions and discoveries increased consoli-
dated companies reserves 63 million barrels worldwide.
e United States and Other Americas each increased
reserves 19 million barrels, and Asia increased reserves
16 million barrels. No single area in the United States was
individually signicant. Drilling activity in Argentina and
Brazil accounted for the majority of the increase in Other
Americas. In Asia, the increase was primarily related to
activity in Azerbaijan.
In 2011, extensions and discoveries increased consoli-
dated companies reserves 299 million barrels worldwide. In
the United States, additions related to two Gulf of Mexico
projects resulted in the majority of the 140 million barrel
increase. In Australia, the Wheatstone Project increased liq-
uid volumes 65 million barrels. Africa and Other Americas
increased reserves 34 million and 30 million barrels, respec-
tively, following the start of new projects in these areas. In
Europe, a new project in the United Kingdom increased
reserves 26 million barrels. In Asia, reserves increased
4 million barrels.
Purchases In 2011, purchases increased worldwide
liquid volumes 42 million barrels. e acquisition of addi-
tional acreage in Canada increased synthetic oil reserves
40 million barrels.
80 Chevron Corporation 2011 Annual Report