Chevron 2011 Annual Report Download - page 81
Download and view the complete annual report
Please find page 81 of the 2011 Chevron annual report below. You can navigate through the pages in the report by either clicking on the pages listed below, or by using the keyword search tool below to find specific information within the annual report.-
 1
1 -
2
-
3
-
4
-
5
-
6
-
7
-
8
-
9
-
10
-
11
-
12
-
13
-
14
-
15
-
16
-
17
-
18
-
19
-
20
-
21
-
22
-
23
-
24
-
25
-
26
-
27
-
28
-
29
-
30
-
31
-
32
-
33
-
34
-
35
-
36
-
37
-
38
-
39
-
40
-
41
-
42
-
43
-
44
-
45
-
46
-
47
-
48
-
49
-
50
-
51
-
52
-
53
-
54
-
55
-
56
-
57
-
58
-
59
-
60
-
61
-
62
-
63
-
64
-
65
-
66
-
67
-
68
-
69
-
70
-
 71
71 -
 72
72 -
 73
73 -
 74
74 -
 75
75 -
 76
76 -
 77
77 -
 78
78 -
 79
79 -
 80
80 -
 81
81 -
 82
82 -
 83
83 -
 84
84 -
 85
85 -
 86
86 -
 87
87 -
 88
88 -
 89
89 -
 90
90 -
 91
91 -
92
 |
 |

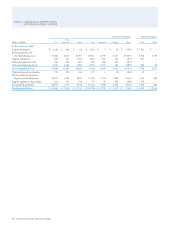
Net Proved Reserves of Crude Oil, Condensate, Natural Gas Liquids and Synthetic Oil
Total
Consolidated Companies Aliated Companies
Consolidated
Other Synthetic Synthetic and Aliated
Millions of barrels U.S. Americas1 Africa Asia Australia Europe Oil2,3 Total TCO Oil2 Other4 Companies
Reserves at January 1, 2009 1,470 149 1,385 1,456 73 202 – 4,735 2,176 – 439 7,350
Changes attributable to:
Revisions 63 (29) (46) (121) 18 10 460 355 (184) 266 (269) 168
Improved recovery 2 – 48 – – – – 50 36 – – 86
Extensions and discoveries 6 13 10 3 20 – – 52 – – – 52
Purchases – – – – – – – – – – – –
Sales (3) (6) – – – – – (9) – – – (9)
Production (177) (23) (151) (167) (13) (42) – (573) (82) – (19) (674)
Reserves at December 31, 20095 1,361 104 1,246 1,171 98 170 460 4,610 1,946 266 151 6,973
Changes attributable to:
Revisions 63 12 17 (26) 3 19 15 103 (33) – 12 82
Improved recovery 11 3 58 2 – – – 74 – – 3 77
Extensions and discoveries 19 19 9 16 – – – 63 – – – 63
Purchases – – – 11 – – – 11 – – – 11
Sales (1) – – – – – – (1) – – – (1)
Production (178) (30) (162) (161) (13) (37) (9) (590) (93) (10) (9) (702)
Reserves at December 31, 20105 1,275 108 1,168 1,013 88 152 466 4,270 1,820 256 157 6,503
Changes attributable to:
Revisions 63 4 60 25 (2) 15 32 197 28 – 10 235
Improved recovery 6 4 48 – – – – 58 – – – 58
Extensions and discoveries 140 30 34 4 65 26 – 299 – – – 299
Purchases 2 – – – – – 40 42 – – – 42
Sales (5) – – – (1) – – (6) – – – (6)
Production (170) (33) (155) (148) (10) (34) (15) (565) (89) (12) (10) (676)
Reserves at December 31, 20115 1,311 113 1,155 894 140 159 523 4,295 1,759 244 157 6,455
1 Ending reserve balances in North America were 13, 14 and 12 and in South America were 100, 94 and 92 in 2011, 2010 and 2009, respectively.
2 Prospective reporting eective December 31, 2009, in accordance with the SEC rule on Modernization of Oil and Gas Reporting.
3 Reserves associated with Canada.
4 Ending reserve balances in Africa were 38, 36 and 31 and in South America were 119, 121 and 120 in 2011, 2010 and 2009, respectively.
5 Included are year-end reserve quantities related to production-sharing contracts (PSC) (refer to page 8 for the denition of a PSC). PSC-related reserve quantities are
22 percent, 24 percent and 26 percent for consolidated companies for 2011, 2010 and 2009, respectively.
Noteworthy amounts in the categories of liquids proved
reserve changes for 2009 through 2011 are discussed below:
Revisions In 2009, net revisions increased reserves by
355 million barrels for worldwide consolidated companies
and decreased reserves by 187 million barrels for equity ali-
ates. For consolidated companies, the largest increase was
460 million barrels in Other Americas due to the inclusion
of synthetic oil related to Canadian oil sands. In the United
States, reserves increased 63 million barrels as a result of
development drilling and performance revisions. e
increases were partially oset by decreases of 121 million
barrels in Asia and 46 million barrels in Africa. In Asia,
decreases in Indonesia and Azerbaijan were driven by the
eect of higher 12-month average prices on the calculation of
reserves associated with production-sharing contracts and the
eect of reservoir performance revisions. In Africa, reserves
in Nigeria declined as a result of higher prices on production-
sharing contracts as well as reservoir performance.
For aliated companies, TCO declined by 184 million
barrels primarily due to the eect of higher 12-month average
prices on royalty determination. For Other aliated compa-
nies, 266 million barrels of heavy crude oil were reclassied
to synthetic oil for the activities in Venezuela.
In 2010, net revisions increased reserves 103 million
barrels for consolidated companies and decreased reserves
21 million barrels for aliated companies. For consolidated
companies, improved reservoir performance accounted for
a majority of the 63 million barrel increase in the United
States. Increases in the other regions were partially oset by
Asia, which decreased as a result of the eect of higher prices
on production-sharing contracts in Kazakhstan. For aliated
companies, the price eect on royalty determination at TCO
decreased reserves by33 million barrels. is was partially
oset by improved reservoir performance and development
drilling in Venezuela.
Table V Reserve Quantity Information – Continued
Chevron Corporation 2011 Annual Report 79