Chevron 2011 Annual Report Download - page 16
Download and view the complete annual report
Please find page 16 of the 2011 Chevron annual report below. You can navigate through the pages in the report by either clicking on the pages listed below, or by using the keyword search tool below to find specific information within the annual report.-
 1
1 -
2
-
3
-
4
-
5
-
 6
6 -
 7
7 -
 8
8 -
 9
9 -
 10
10 -
 11
11 -
 12
12 -
 13
13 -
 14
14 -
 15
15 -
 16
16 -
 17
17 -
 18
18 -
 19
19 -
 20
20 -
 21
21 -
 22
22 -
 23
23 -
 24
24 -
 25
25 -
 26
26 -
27
-
28
-
29
-
30
-
31
-
32
-
33
-
34
-
35
-
36
-
37
-
38
-
39
-
40
-
41
-
42
-
43
-
44
-
45
-
46
-
47
-
48
-
49
-
50
-
51
-
52
-
53
-
54
-
55
-
56
-
57
-
58
-
59
-
60
-
61
-
62
-
63
-
64
-
65
-
66
-
67
-
68
-
69
-
70
-
71
-
72
-
73
-
74
-
75
-
76
-
77
-
78
-
79
-
80
-
81
-
82
-
83
-
84
-
85
-
86
-
87
-
88
-
89
-
90
-
91
-
92
 |
 |

Management’s Discussion and Analysis of
Financial Condition and Results of Operations
14 Chevron Corporation 2011 Annual Report
Management’s Discussion and Analysis of
Financial Condition and Results of Operations
350,000 total acres in the Antrim and Collingwood/Utica
Shale formations. Additional asset acquisitions in 2011
expanded the company’s holdings in the Marcellus and
Utica to approximately 700,000 and 600,000 total acres,
respectively.
Downstream
Africa During 2011, the company completed the sale of cer-
tain marketing businesses in ve countries in Africa.
Caribbean and Latin America In 2011, the company
completed the sale of its fuels marketing and aviation busi-
nesses in 16 countries in the Caribbean and Latin America.
In fourth quarter 2011, the company signed agreements to
sell certain fuels marketing and aviation businesses in the
Central Caribbean. e company expects to complete these
sales in 2012 following receipt of required local regulatory
and government approvals.
Europe In August 2011, the company completed the sale
of its rening and marketing assets in the United Kingdom
and Ireland, including the Pembroke Renery.
Singapore In February 2012, the company reached a
nal investment decision to signicantly increase the capacity
of the existing additives plant in Singapore.
United States In January 2011, the company announced
the nal investment decision on a $1.4 billion project to
construct a base oil manufacturing facility at the Pascagoula,
Mississippi, renery. e facility is expected to produce
approximately 25,000 barrels per day of premium base oil.
Other
Common Stock Dividends e quarterly common stock
dividend increased by 8.3 percent in April 2011 and by
3.8 percent in October 2011, to $0.81 per common share,
making 2011 the 24th consecutive year that the company
increased its annual dividend payment.
Common Stock Repurchase Program e company pur-
chased $4.25 billion of its common stock in 2011 under its
share repurchase program. e program began in 2010 and
has no set term or monetary limits.
Results of Operations
Major Operating Areas e following section presents the
results of operations for the company’s business segments –
Upstream and Downstream – as well as for “All Other.”
Earnings are also presented for the U.S. and international
geographic areas of the Upstream and Downstream business
segments. Refer to Note 11, beginning on page 45, for a
discussion of the company’s “reportable segments,” as dened
in accounting standards forsegment reporting (Accounting
Standards Codication (ASC) 280). is section should also
be read in conjunction with the discussion in “Business
Environment and Outlook” on pages 10 through 13.
U.S. Upstream
Millions of dollars 2011 2010 2009
Earnings $ 6,512 $ 4,122 $ 2,262
U.S. upstream earnings of $6.51 billion in 2011 increased
$2.4 billion from 2010. e benet of higher crude oil real-
izations increased earnings by $2.8 billion between periods.
Partly osetting this eect were lower net oil-equivalent pro-
duction which decreased earnings by about $400 million and
higher operating expenses of $200 million.
U.S. upstream earnings of $4.1 billion in 2010 increased
$1.9 billion from 2009. Higher prices for crude oil and natu-
ral gas increased earnings by $2.1 billion between periods.
Partly osetting these eects were higher operating expenses
of $200 million, in part due to the Gulf of Mexico drilling
moratorium. Lower exploration expenses were essentially o-
set by higher tax items and higher depreciation expenses.
e company’s average realization for U.S. crude oil and
natural gas liquids in 2011 was $97.51 per barrel, compared
with $71.59 in 2010 and $54.36 in 2009. e average
natural gas realization was $4.04 per thousand cubic feet in
2011, compared with $4.26 and $3.73 in 2010 and 2009,
respectively.
Net oil-equivalent production in 2011 averaged 678,000
barrels per day, down 4 percent from 2010 and 5 percent
from 2009. Between 2011 and 2010, the decrease in produc-
tion was associated with normal eld declines and
maintenance-related downtime. Partially osetting this
decrease were new production from acquisitions in the Mar-
cellus Shale and increases at the Perdido project in the Gulf of
Mexico. Natural eld declines between 2010 and 2009 were
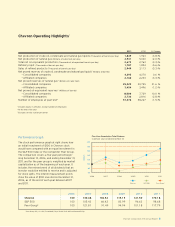
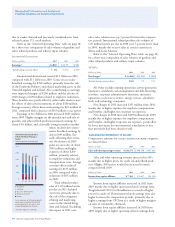
0
1500
1200
900
600
300
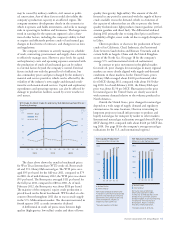
Exploration Expenses
Millions of dollars
United States
International
Exploration expenses increased
6 percent from 2010 mainly due
to higher geological and
geophysical expense in the
international segment.
0807 09 10 11
$1,216
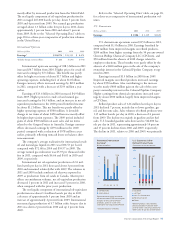
0.0
25.0
15.0
20.0
10.0
5.0
Worldwide Upstream Earnings
Billions of dollars
Earnings increased in 2011 on
higher average prices for crude oil.
United States
International
0807 09 10 11
$24.8