Chevron 2011 Annual Report Download - page 12
Download and view the complete annual report
Please find page 12 of the 2011 Chevron annual report below. You can navigate through the pages in the report by either clicking on the pages listed below, or by using the keyword search tool below to find specific information within the annual report.-
 1
1 -
 2
2 -
 3
3 -
 4
4 -
 5
5 -
 6
6 -
 7
7 -
 8
8 -
 9
9 -
 10
10 -
 11
11 -
 12
12 -
 13
13 -
 14
14 -
 15
15 -
 16
16 -
 17
17 -
 18
18 -
 19
19 -
 20
20 -
 21
21 -
 22
22 -
23
-
24
-
25
-
26
-
27
-
28
-
29
-
30
-
31
-
32
-
33
-
34
-
35
-
36
-
37
-
38
-
39
-
40
-
41
-
42
-
43
-
44
-
45
-
46
-
47
-
48
-
49
-
50
-
51
-
52
-
53
-
54
-
55
-
56
-
57
-
58
-
59
-
60
-
61
-
62
-
63
-
64
-
65
-
66
-
67
-
68
-
69
-
70
-
71
-
72
-
73
-
74
-
75
-
76
-
77
-
78
-
79
-
80
-
81
-
82
-
83
-
84
-
85
-
86
-
87
-
88
-
89
-
90
-
91
-
92
 |
 |

Management’s Discussion and Analysis of
Financial Condition and Results of Operations
10 Chevron Corporation 2011 Annual Report
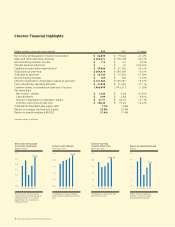
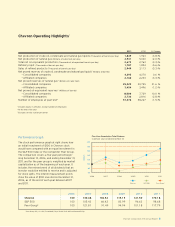
Key Financial Results
Millions of dollars, except per-share amounts 2011 2010 2009
Net Income Attributable to
Chevron Corporation $ 26,895 $ 19,024 $ 10,483
Per Share Amounts:
Net Income Attributable to
Chevron Corporation
– Basic $ 13.54 $ 9.53 $ 5.26
– Diluted $ 13.44 $ 9.48 $ 5.24
Dividends $ 3.09 $ 2.84 $ 2.66
Sales and Other
Operating Revenues $ 244,371 $ 198,198 $ 167,402
Return on:
Capital Employed 21.6% 17.4% 10.6%
Stockholders’ Equity 23.8% 19.3% 11.7%
Earnings by Major Operating Area
Millions of dollars 2011 2010 2009
Upstream1
United States $ 6,512 $ 4,122 $ 2,262
International 18,274 13,555 8,670
Total Upstream 24,786 17,677 10,932
Downstream1
United States 1,506 1,339 (121)
International 2,085 1,139 594
Total Downstream 3,591 2,478 473
All Other (1,482) (1,131) (922)
Net Income Attributable to
Chevron Corporation2,3 $ 26,895 $ 19,024 $ 10,483
1 2009 information has been revised to conform with the 2011 and 2010 segment
presentation.
2 Includes foreign currency eects: $ 121 $ (423) $ (744)
3 Also referred to as “earnings” in the discussions that follow.
Refer to the “Results of Operations” section beginning
on page 14 for a discussion of nancial results by major
operating area for the three years ended December 31, 2011.
Business Environment and Outlook
Chevron is a global energy company with substantial busi-
ness activities in the following countries: Angola, Argentina,
Australia, Azerbaijan, Bangladesh, Brazil, Cambodia,
Canada, Chad, China, Colombia, Democratic Republic of
the Congo, Denmark, Indonesia, Kazakhstan, Myanmar, the
Netherlands, Nigeria, Norway, the Partitioned Zone between
Saudi Arabia and Kuwait, the Philippines, Republic of the
Congo, Singapore, South Africa, South Korea, ailand,
Trinidad and Tobago, the United Kingdom, the United
States, Venezuela and Vietnam.
Earnings of the company depend mostly on the prot-
ability of its upstream and downstream business segments.
e single biggest factor that aects the results of operations
for the company is movement in the price of crude oil. In the
downstream business, crude oil is the largest cost component
of rened products. Seasonality is not a primary driver of
changes in the company’s quarterly earnings during the year.
To sustain its long-term competitive position in the
upstream business, the company must develop and replenish
an inventory of projects that oer attractive nancial returns
for the investment required. Identifying promising areas for
exploration, acquiring the necessary rights to explore for and
to produce crude oil and natural gas, drilling successfully,
and handling the many technical and operational details in
a safe and cost-eective manner are all important factors in
this eort. Projects often require long lead times and large
capital commitments.
e company’s operations, especially upstream, can also
be aected by changing economic, regulatory and political
environments in the various countries in which it operates,
including the United States. From time to time, certain
governments have sought to renegotiate contracts or impose
additional costs on the company. Governments may attempt
to do so in the future. Civil unrest, acts of violence or
strained relations between a government and the company or
other governments may impact the company’s operations or
investments. ose developments have at times signicantly
aected the company’s operations and results and are care-
fully considered by management when evaluating the level of
current and future activity in such countries.
e company also continually evaluates opportunities to
dispose of assets that are not expected to provide sucient
long-term value or to acquire assets or operations comple-
mentary to its asset base to help augment the company’s
nancial performance and growth. Refer to the “Results of
Operations” section beginning on page 14 for discussions of
net gains on asset sales during 2011. Asset dispositions and
restructurings may also occur in future periods and could
result in signicant gains or losses.
e company closely monitors developments in the
nancial and credit markets, the level of worldwide economic
activity, and the implications for the company of movements
in prices for crude oil and natural gas. Management takes
these developments into account in the conduct of daily
operations and for business planning.
Comments related to earnings trends for the company’s
major business areas are as follows:
Upstream Earnings for the upstream segment are closely
aligned with industry price levels for crude oil and natural
gas. Crude oil and natural gas prices are subject to external
factors over which the company has no control, including
product demand connected with global economic conditions,
industry inventory levels, production quotas imposed by the
Organization of Petroleum Exporting Countries (OPEC),
weather-related damage and disruptions, competing fuel
prices, and regional supply interruptions or fears thereof that
Management’s Discussion and Analysis of
Financial Condition and Results of Operations