Chevron 2011 Annual Report Download - page 17
Download and view the complete annual report
Please find page 17 of the 2011 Chevron annual report below. You can navigate through the pages in the report by either clicking on the pages listed below, or by using the keyword search tool below to find specific information within the annual report.-
 1
1 -
2
-
3
-
4
-
5
-
6
-
 7
7 -
 8
8 -
 9
9 -
 10
10 -
 11
11 -
 12
12 -
 13
13 -
 14
14 -
 15
15 -
 16
16 -
 17
17 -
 18
18 -
 19
19 -
 20
20 -
 21
21 -
 22
22 -
 23
23 -
 24
24 -
 25
25 -
 26
26 -
 27
27 -
28
-
29
-
30
-
31
-
32
-
33
-
34
-
35
-
36
-
37
-
38
-
39
-
40
-
41
-
42
-
43
-
44
-
45
-
46
-
47
-
48
-
49
-
50
-
51
-
52
-
53
-
54
-
55
-
56
-
57
-
58
-
59
-
60
-
61
-
62
-
63
-
64
-
65
-
66
-
67
-
68
-
69
-
70
-
71
-
72
-
73
-
74
-
75
-
76
-
77
-
78
-
79
-
80
-
81
-
82
-
83
-
84
-
85
-
86
-
87
-
88
-
89
-
90
-
91
-
92
 |
 |

Chevron Corporation 2011 Annual Report 15
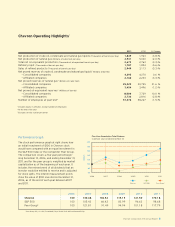
mostly oset by increased production from the Tahiti Field.
e net liquids component of oil-equivalent production for
2011 averaged 465,000 barrels per day, down 5 percent from
2010 and 4 percent from 2009. Net natural gas production
averaged about 1.3 billion cubic feet per day in 2011, down
approximately 3 percent from 2010 and about 9 percent
from 2009. Refer to the “Selected Operating Data” table on
page 18 for a three-year comparative of production volumes
in the United States.
International Upstream
Millions of dollars 2011 2010 2009
Earnings* $ 18,274 $ 13,555 $ 8,670
*Includes foreign currency eects: $ 211 $ (293) $ (578)
International upstream earnings of $18.3 billion in 2011
increased $4.7 billion from 2010. Higher prices for crude oil
increased earnings by $7.1 billion. is benet was partly
oset by higher tax items of about $1.7 billion and higher
operating expenses, including fuel, of about $1.0 billion.
Foreign currency eects increased earnings by $211 million
in 2011, compared with a decrease of $293 million a year
earlier.
Earnings of $13.6 billion in 2010 increased $4.9 billion
from 2009. Higher prices for crude oil and natural gas
increased earnings by $4.3 billion, and an increase in net oil-
equivalent production in the 2010 period beneted income
by about $1.2 billion. is net benet was partly oset by
higher operating expenses of $500 million. A favorable
change in tax items of about $450 million was mostly oset
by higher depreciation expenses. e 2009 period included
gains of about $500 million on asset sales and tax items
related to the Gorgon Project in Australia. Foreign currency
eects decreased earnings by $293 million in the 2010
period, compared with a reduction of $578 million a year
earlier, primarily reecting noncash losses on balance sheet
remeasurement.
e company’s average realization for international crude
oil and natural gas liquids in 2011 was $101.53 per barrel,
compared with $72.68 in 2010 and $55.97 in 2009. e
average natural gas realization was $5.39 per thousand cubic
feet in 2011, compared with $4.64 and $4.01 in 2010 and
2009, respectively.
International net oil-equivalent production of 2.0 mil-
lion barrels per day in 2011 decreased about 3 percent from
2010 and remained relatively at with 2009. e volumes in
2011 and 2010 include synthetic oil that was reported in
2009 as production from oil sands in Canada. Absent price
eects on entitlement volumes, net oil-equivalent production
decreased 1 percent in 2011 and increased 5 percent in 2010,
when compared with the prior year’s production.
e net liquids component of international oil-equivalent
production was about 1.4 million barrels per day in 2011,
a decrease of approximately 3 percent from 2010 and an
increase of approximately 2 percent from 2009. International
net natural gas production of 3.7 billion cubic feet per day in
2011 was down 2 percent from 2010 and up 2 percent from
2009.
Refer to the “Selected Operating Data” table, on page 18,
for a three-year comparative of international production vol-
umes.
U.S. Downstream
Millions of dollars 2011 2010 2009
Earnings $ 1,506 $ 1,339 $ (121)
U.S. downstream operations earned $1.5 billion in 2011,
compared with $1.3 billion in 2010. Earnings beneted by
$300 million from improved margins on rened products,
$200 million from higher earnings from the 50 percent-owned
Chevron Phillips Chemical Company LLC (CPChem), and
$50 million from the absence of 2010 charges related to
employee reductions. ese benets were partly oset by the
absence of a $400 million gain on the sale of the company’s
ownership interest in the Colonial Pipeline Company recog-
nized in 2010.
Earnings increased $1.5 billion in 2010 from 2009.
Improved margins on rened products increased earnings
by about $550 million. Also contributing to the increase
was the nearly $400 million gain on the sale of the com-
pany’s ownership interest in the Colonial Pipeline Company.
Higher earnings from chemicals operations increased earn-
ings by about $300 million, largely from improved margins
at CPChem.
Rened product sales of 1.26 million barrels per day in
2011 declined 7 percent, mainly due to lower gasoline, gas
oil, and kerosene sales. Sales volumes of rened products were
1.35 million barrels per day in 2010, a decrease of 4 percent
from 2009. e decline was mainly in gasoline and jet fuel
sales. U.S. branded gasoline sales decreased to 514,000 bar-
rels per day in 2011, representing approximately 10 percent
and 17 percent declines from 2010 and 2009, respectively.
e decline in 2011, relative to 2010 and 2009, was primarily
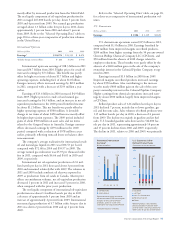
Downstream earnings increased
45 percent from 2010 due to higher
margins on the sale of refined
products, gains on asset sales
and higher earnings from CPChem.
*Includes equity in affiliates.
United States
International
-0.5
4.5
3.5
2.5
0.5
1.5
Worldwide Downstream
Earnings*
Billions of dollars
$3.6
0807 09 10 11
0
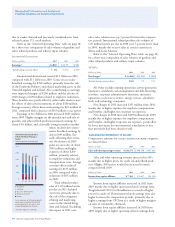
1600
1200
800
400
U.S. Gasoline & Other
Refined Product Sales
Thousands of barrels per day
Gasoline
Jet Fuel
Gas Oils & Kerosene
Residual Fuel Oil
Other
Refined-product sales volumes
decreased about 7 percent from
2010 on lower sales of gasoline and
lower sales of gas oils and kerosene.
1,257
0807 09 10 11