Avis 2014 Annual Report Download - page 73
Download and view the complete annual report
Please find page 73 of the 2014 Avis annual report below. You can navigate through the pages in the report by either clicking on the pages listed below, or by using the keyword search tool below to find specific information within the annual report.-
 1
1 -
2
-
3
-
4
-
5
-
6
-
7
-
8
-
9
-
10
-
11
-
12
-
13
-
14
-
15
-
16
-
17
-
18
-
19
-
20
-
21
-
22
-
23
-
24
-
25
-
26
-
27
-
28
-
29
-
30
-
31
-
32
-
33
-
34
-
35
-
36
-
37
-
38
-
39
-
40
-
41
-
42
-
43
-
44
-
45
-
46
-
47
-
48
-
49
-
50
-
51
-
52
-
53
-
54
-
55
-
56
-
57
-
58
-
59
-
60
-
61
-
62
-
 63
63 -
 64
64 -
 65
65 -
 66
66 -
 67
67 -
 68
68 -
 69
69 -
 70
70 -
 71
71 -
 72
72 -
 73
73 -
 74
74 -
 75
75 -
 76
76 -
 77
77 -
 78
78 -
 79
79 -
 80
80 -
 81
81 -
 82
82 -
 83
83 -
84
-
85
-
86
-
87
-
88
-
89
-
90
-
91
-
92
-
93
-
94
-
95
-
96
-
97
-
98
-
99
-
100
-
101
-
102
-
103
-
104
-
105
-
106
-
107
-
108
-
109
-
110
-
111
-
112
-
113
-
114
-
115
-
116
-
117
-
118
-
119
-
120
-
121
-
122
-
123
-
124
-
125
-
126
-
127
-
128
-
129
-
130
-
131
-
132
-
133
-
134
-
135
-
136
-
137
 |
 |

F-6
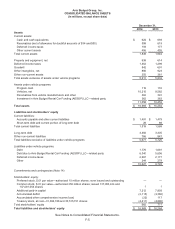
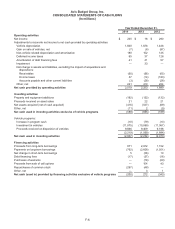
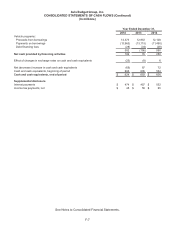
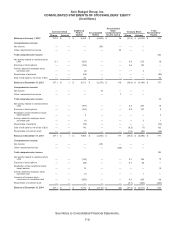
Avis Budget Group, Inc.
CONSOLIDATED STATEMENTS OF CASH FLOWS
(In millions)
Year Ended December 31,
2014 2013 2012
Operating activities
Net income $ 245 $ 16 $ 290
Adjustments to reconcile net income to net cash provided by operating activities:
Vehicle depreciation 1,840 1,678 1,438
Gain on sale of vehicles, net (7) (6) (97)
Non-vehicle related depreciation and amortization 180 152 125
Deferred income taxes 65 37 128
Amortization of debt financing fees 41 41 57
Impairment —33 —
Net change in assets and liabilities, excluding the impact of acquisitions and
dispositions:
Receivables (60) (66) (65)
Income taxes 37 (14) (183)
Accounts payable and other current liabilities (3) (28) (28)
Other, net 241 410 224
Net cash provided by operating activities 2,579 2,253 1,889
Investing activities
Property and equipment additions (182) (152) (132)
Proceeds received on asset sales 21 22 21
Net assets acquired (net of cash acquired) (416) (537) (69)
Other, net (11) 2 (9)
Net cash used in investing activities exclusive of vehicle programs (588) (665) (189)
Vehicle programs:
Increase in program cash (10) (79) (13)
Investment in vehicles (11,875) (10,899) (11,067)
Proceeds received on disposition of vehicles 9,666 9,409 9,196
(2,219) (1,569) (1,884)
Net cash used in investing activities (2,807) (2,234) (2,073)
Financing activities
Proceeds from long-term borrowings 871 2,972 1,152
Payments on long-term borrowings (762) (2,608) (1,501)
Net change in short-term borrowings 5 (36) 10
Debt financing fees (17) (37) (16)
Purchases of warrants — (78) (29)
Proceeds from sale of call options — 104 43
Repurchases of common stock (297) (48) —
Other, net —31
Net cash (used in) provided by financing activities exclusive of vehicle programs (200) 272 (340)