Avis 2014 Annual Report Download - page 102
Download and view the complete annual report
Please find page 102 of the 2014 Avis annual report below. You can navigate through the pages in the report by either clicking on the pages listed below, or by using the keyword search tool below to find specific information within the annual report.-
 1
1 -
2
-
3
-
4
-
5
-
6
-
7
-
8
-
9
-
10
-
11
-
12
-
13
-
14
-
15
-
16
-
17
-
18
-
19
-
20
-
21
-
22
-
23
-
24
-
25
-
26
-
27
-
28
-
29
-
30
-
31
-
32
-
33
-
34
-
35
-
36
-
37
-
38
-
39
-
40
-
41
-
42
-
43
-
44
-
45
-
46
-
47
-
48
-
49
-
50
-
51
-
52
-
53
-
54
-
55
-
56
-
57
-
58
-
59
-
60
-
61
-
62
-
63
-
64
-
65
-
66
-
67
-
68
-
69
-
70
-
71
-
72
-
73
-
74
-
75
-
76
-
77
-
78
-
79
-
80
-
81
-
82
-
83
-
84
-
85
-
86
-
87
-
88
-
89
-
90
-
91
-
 92
92 -
 93
93 -
 94
94 -
 95
95 -
 96
96 -
 97
97 -
 98
98 -
 99
99 -
 100
100 -
 101
101 -
 102
102 -
 103
103 -
 104
104 -
 105
105 -
 106
106 -
 107
107 -
 108
108 -
 109
109 -
 110
110 -
 111
111 -
 112
112 -
113
-
114
-
115
-
116
-
117
-
118
-
119
-
120
-
121
-
122
-
123
-
124
-
125
-
126
-
127
-
128
-
129
-
130
-
131
-
132
-
133
-
134
-
135
-
136
-
137
 |
 |

F-35
Stock Options
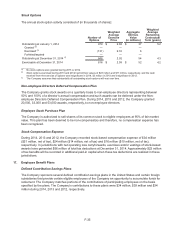
The annual stock option activity consisted of (in thousands of shares):
Number of
Options
Weighted
Average
Exercise
Price
Aggregate
Intrinsic
Value
(in millions)
Weighted
Average
Remaining
Contractual
Term (years)
Outstanding at January 1, 2014 979 $ 2.82 $ 37 5.2
Granted (a) ———
Exercised (b) (131) 2.16 6
Forfeited/expired — — —
Outstanding at December 31, 2014 (c) 848 2.92 54 4.3
Exercisable at December 31, 2014 816 $ 2.59 $ 52 4.2
__________
(a) No stock options were granted during 2013 or 2012.
(b) Stock options exercised during 2013 and 2012 had intrinsic values of $23 million and $11 million, respectively, and the cash
received from the exercise of options was insignificant in 2014, $3 million in 2013 and insignificant in 2012.
(c) The Company assumes that substantially all outstanding stock options will vest over time.
Non-employee Directors Deferred Compensation Plan
The Company grants stock awards on a quarterly basis to non-employee directors representing between
50% and 100% of a director’s annual compensation and such awards can be deferred under the Non-
employee Directors Deferred Compensation Plan. During 2014, 2013 and 2012, the Company granted
20,000, 33,000 and 53,000 awards, respectively, to non-employee directors.
Employee Stock Purchase Plan
The Company is authorized to sell shares of its common stock to eligible employees at 95% of fair market
value. This plan has been deemed to be non-compensatory and therefore, no compensation expense has
been recognized.
Stock-Compensation Expense
During 2014, 2013 and 2012, the Company recorded stock-based compensation expense of $34 million
($21 million, net of tax), $24 million ($14 million, net of tax) and $16 million ($10 million, net of tax),
respectively. In jurisdictions with net operating loss carryforwards, exercises and/or vestings of stock-based
awards have generated $56 million of total tax deductions at December 31, 2014. Approximately $22 million
of tax benefits will be recorded in additional paid-in capital when these tax deductions are realized in these
jurisdictions.
17. Employee Benefit Plans
Defined Contribution Savings Plans
The Company sponsors several defined contribution savings plans in the United States and certain foreign
subsidiaries that provide certain eligible employees of the Company an opportunity to accumulate funds for
retirement. The Company matches portions of the contributions of participating employees on the basis
specified by the plans. The Company’s contributions to these plans were $34 million, $39 million and $34
million during 2014, 2013 and 2012, respectively.