Avis 2014 Annual Report Download - page 48
Download and view the complete annual report
Please find page 48 of the 2014 Avis annual report below. You can navigate through the pages in the report by either clicking on the pages listed below, or by using the keyword search tool below to find specific information within the annual report.-
 1
1 -
2
-
3
-
4
-
5
-
6
-
7
-
8
-
9
-
10
-
11
-
12
-
13
-
14
-
15
-
16
-
17
-
18
-
19
-
20
-
21
-
22
-
23
-
24
-
25
-
26
-
27
-
28
-
29
-
30
-
31
-
32
-
33
-
34
-
35
-
36
-
37
-
 38
38 -
 39
39 -
 40
40 -
 41
41 -
 42
42 -
 43
43 -
 44
44 -
 45
45 -
 46
46 -
 47
47 -
 48
48 -
 49
49 -
 50
50 -
 51
51 -
 52
52 -
 53
53 -
 54
54 -
 55
55 -
 56
56 -
 57
57 -
 58
58 -
59
-
60
-
61
-
62
-
63
-
64
-
65
-
66
-
67
-
68
-
69
-
70
-
71
-
72
-
73
-
74
-
75
-
76
-
77
-
78
-
79
-
80
-
81
-
82
-
83
-
84
-
85
-
86
-
87
-
88
-
89
-
90
-
91
-
92
-
93
-
94
-
95
-
96
-
97
-
98
-
99
-
100
-
101
-
102
-
103
-
104
-
105
-
106
-
107
-
108
-
109
-
110
-
111
-
112
-
113
-
114
-
115
-
116
-
117
-
118
-
119
-
120
-
121
-
122
-
123
-
124
-
125
-
126
-
127
-
128
-
129
-
130
-
131
-
132
-
133
-
134
-
135
-
136
-
137
 |
 |

41
Management evaluates the operating results of each of our reportable segments based upon revenue and
“Adjusted EBITDA,” which we define as income from continuing operations before non-vehicle related
depreciation and amortization, any impairment charges, restructuring expense, early extinguishment of debt
costs, non-vehicle related interest, transaction-related costs and income taxes.
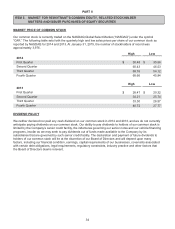
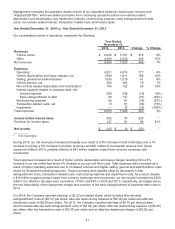
Year Ended December 31, 2014 vs. Year Ended December 31, 2013
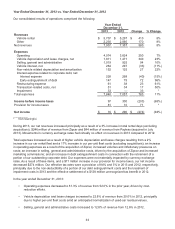
Our consolidated results of operations comprised the following:
Year Ended
December 31,
2014 2013 Change % Change
Revenues
Vehicle rental $ 6,026 $ 5,707 $ 319 6%
Other 2,459 2,230 229 10%
Net revenues 8,485 7,937 548 7%
Expenses
Operating 4,251 4,074 177 4%
Vehicle depreciation and lease charges, net 1,996 1,811 185 10%
Selling, general and administrative 1,080 1,019 61 6%
Vehicle interest, net 282 264 18 7%
Non-vehicle related depreciation and amortization 180 152 28 18%
Interest expense related to corporate debt, net:
Interest expense 209 228 (19) (8%)
Early extinguishment of debt 56 147 (91) (62%)
Restructuring expense 26 61 (35) (57%)
Transaction-related costs, net 13 51 (38) (75%)
Impairment — 33 (33) (100%)
Total expenses 8,093 7,840 253 3%
Income before income taxes 392 97 295 *
Provision for income taxes 147 81 66 81%
Net income $ 245 $ 16 $ 229 *
__________
* Not meaningful.
During 2014, our net revenues increased principally as a result of a 5% increase in total rental days and a 1%
increase in pricing, a 9% increase in ancillary revenues and $67 million of incremental revenue from Zipcar
(acquired in March 2013), partially offset by a $43 million negative impact from currency exchange rate
movements.
Total expenses increased as a result of higher vehicle depreciation and lease charges resulting from a 5%
increase in our car rental fleet and a 4% increase in our per-unit fleet costs. Total expenses also increased as a
result of higher operating expenses due to increased volumes and higher selling, general and administrative costs
driven by increased marketing expenses. These increases were partially offset by decreases in debt
extinguishment costs, transaction-related costs, restructuring expense and impairment costs. As a result, despite
a $16 million negative pretax impact from currency exchange rate movements, our net income increased by $229
million. Our effective tax rates were a provision of 38% and 84% in 2014 and 2013, respectively, principally due to
the non-deductibility of the impairment charge and a portion of the early extinguishment of corporate debt costs in
2013.
For 2014, the Company reported earnings of $2.22 per diluted share, which includes after-tax debt
extinguishment costs of ($0.31) per share, after-tax restructuring expense of ($0.16) per share and after-tax
transaction costs of ($0.08) per share. For 2013, the Company reported earnings of $0.15 per diluted share,
which includes after-tax debt extinguishment costs of ($0.94) per share, after-tax restructuring expense of ($0.35)
per share, after-tax transaction costs of ($0.35) per share and an after-tax impairment charge of ($0.28) per
share.