Avis 2014 Annual Report Download - page 47
Download and view the complete annual report
Please find page 47 of the 2014 Avis annual report below. You can navigate through the pages in the report by either clicking on the pages listed below, or by using the keyword search tool below to find specific information within the annual report.-
 1
1 -
2
-
3
-
4
-
5
-
6
-
7
-
8
-
9
-
10
-
11
-
12
-
13
-
14
-
15
-
16
-
17
-
18
-
19
-
20
-
21
-
22
-
23
-
24
-
25
-
26
-
27
-
28
-
29
-
30
-
31
-
32
-
33
-
34
-
35
-
36
-
 37
37 -
 38
38 -
 39
39 -
 40
40 -
 41
41 -
 42
42 -
 43
43 -
 44
44 -
 45
45 -
 46
46 -
 47
47 -
 48
48 -
 49
49 -
 50
50 -
 51
51 -
 52
52 -
 53
53 -
 54
54 -
 55
55 -
 56
56 -
 57
57 -
58
-
59
-
60
-
61
-
62
-
63
-
64
-
65
-
66
-
67
-
68
-
69
-
70
-
71
-
72
-
73
-
74
-
75
-
76
-
77
-
78
-
79
-
80
-
81
-
82
-
83
-
84
-
85
-
86
-
87
-
88
-
89
-
90
-
91
-
92
-
93
-
94
-
95
-
96
-
97
-
98
-
99
-
100
-
101
-
102
-
103
-
104
-
105
-
106
-
107
-
108
-
109
-
110
-
111
-
112
-
113
-
114
-
115
-
116
-
117
-
118
-
119
-
120
-
121
-
122
-
123
-
124
-
125
-
126
-
127
-
128
-
129
-
130
-
131
-
132
-
133
-
134
-
135
-
136
-
137
 |
 |

40
• changes in currency exchange rates; and
• demand for truck rentals.
Throughout 2014, we operated in an uncertain and uneven economic environment marked by heightened
geopolitical risks and an unprecedented level of vehicle manufacturer recalls. We expect such economic
conditions to continue in 2015. Nonetheless, we continue to anticipate that worldwide demand for vehicle rental
and car sharing services will increase in 2015, most likely against a backdrop of modest and uneven global
economic growth. Our access to new fleet vehicles has been adequate to meet our needs for both replacement of
existing vehicles in the normal course and for growth to meet incremental demand, and we expect that to continue
to be the case. We will look to pursue opportunities for further pricing increases in 2015 to enhance our returns on
invested capital and profitability.
Our objective continues to be to focus on strategically accelerating our growth, strengthening our global position
as a leading provider of vehicle rental services, continuing to enhance our customers’ rental experience, and
controlling costs and driving efficiency throughout the organization. We operate in a highly competitive industry
and we expect to continue to face challenges and risks. We seek to mitigate our exposure to risks in numerous
ways, including delivering upon our core strategic initiatives and through continued optimization of fleet levels to
match changes in demand for vehicle rentals, maintenance of liquidity to fund our fleet and our operations,
appropriate investments in technology and adjustments in the size, nature and terms of our relationships with
vehicle manufacturers.
2014 HIGHLIGHTS
In 2014, we achieved record transaction volumes and revenues and had the highest Adjusted EBITDA in our
history:
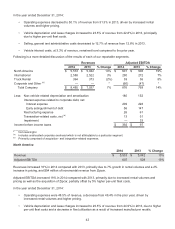
• Our net revenues increased 7% year-over-year to $8.5 billion in 2014.
• Pricing (our average T&M revenue per rental day) increased 2% in North America, driven by increases in
both commercial and leisure pricing.
• Adjusted EBITDA increased 14% to $876 million in 2014, primarily as a result of higher rental volumes and
increased year-over-year pricing in North America, partially offset by higher fleet costs.
• We redeemed all $687 million of our outstanding 8¼% Senior Notes due 2019 using the proceeds from our
issuance of $400 million of Senior Notes due 2022 and €200 million of additional euro-denominated
6% Senior Notes due 2021.
• We repurchased $300 million of our common stock, reducing our shares outstanding by approximately 5.7
million shares.
• We acquired our Budget licensees in Southern California and Las Vegas as well as Edmonton, Alberta,
Canada, and also re-acquired the right to operate the Budget brand in Portugal.
• Our share price increased 64% to $66.33.
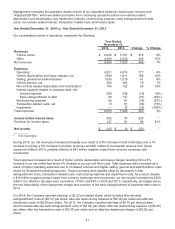
RESULTS OF OPERATIONS
We measure performance principally using the following key operating statistics: (i) rental days, which represents
the total number of days (or portion thereof) a vehicle was rented, and (ii) T&M revenue per rental day, which
represents the average daily revenue we earned from rental and mileage fees charged to our customers, both of
which exclude our Zipcar car sharing operations. We also measure our ancillary revenues (rental-transaction
revenue other than T&M revenue), such as from the sale of collision and loss damage waivers, insurance
products, fuel service options and portable GPS navigation unit rentals. Our vehicle rental operating statistics
(rental days and T&M revenue per rental day) are all calculated based on the actual rental of the vehicle during a
24-hour period. We believe that this methodology provides our management with the most relevant statistics in
order to manage the business. Our calculation may not be comparable to other companies’ calculation of
similarly-titled statistics.
We assess performance and allocate resources based upon the separate financial information of our operating
segments. In identifying our reportable segments, we also consider the nature of services provided by our
operating segments, the geographical areas in which our segments operate and other relevant factors.