Avis 2014 Annual Report Download - page 56
Download and view the complete annual report
Please find page 56 of the 2014 Avis annual report below. You can navigate through the pages in the report by either clicking on the pages listed below, or by using the keyword search tool below to find specific information within the annual report.-
 1
1 -
2
-
3
-
4
-
5
-
6
-
7
-
8
-
9
-
10
-
11
-
12
-
13
-
14
-
15
-
16
-
17
-
18
-
19
-
20
-
21
-
22
-
23
-
24
-
25
-
26
-
27
-
28
-
29
-
30
-
31
-
32
-
33
-
34
-
35
-
36
-
37
-
38
-
39
-
40
-
41
-
42
-
43
-
44
-
45
-
 46
46 -
 47
47 -
 48
48 -
 49
49 -
 50
50 -
 51
51 -
 52
52 -
 53
53 -
 54
54 -
 55
55 -
 56
56 -
 57
57 -
 58
58 -
 59
59 -
 60
60 -
 61
61 -
 62
62 -
 63
63 -
 64
64 -
 65
65 -
 66
66 -
67
-
68
-
69
-
70
-
71
-
72
-
73
-
74
-
75
-
76
-
77
-
78
-
79
-
80
-
81
-
82
-
83
-
84
-
85
-
86
-
87
-
88
-
89
-
90
-
91
-
92
-
93
-
94
-
95
-
96
-
97
-
98
-
99
-
100
-
101
-
102
-
103
-
104
-
105
-
106
-
107
-
108
-
109
-
110
-
111
-
112
-
113
-
114
-
115
-
116
-
117
-
118
-
119
-
120
-
121
-
122
-
123
-
124
-
125
-
126
-
127
-
128
-
129
-
130
-
131
-
132
-
133
-
134
-
135
-
136
-
137
 |
 |

49
Year Ended December 31, 2013 vs. Year Ended December 31, 2012
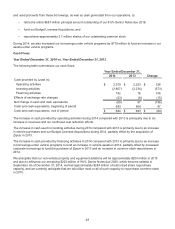
The following table summarizes our cash flows:
Year Ended December 31,
2013 2012 Change
Cash provided by (used in):
Operating activities $ 2,253 $ 1,889 $ 364
Investing activities (2,234) (2,073) (161)
Financing activities 76 250 (174)
Effects of exchange rate changes (8) 6 (14)
Net change in cash and cash equivalents 87 72 15
Cash and cash equivalents, beginning of period 606 534 72
Cash and cash equivalents, end of period $ 693 $ 606 $ 87
The increase in cash provided by operating activities during 2013 compared to 2012 is principally due to
increased revenues and our continued cost reduction efforts.
The increase in cash used in investing activities during 2013 compared with 2012 is primarily due to the
acquisitions of Zipcar and Payless, partially offset by an increase in proceeds from the sale of vehicles and a
decrease in our investment in vehicles.
The decrease in cash provided by financing activities in 2013 compared with 2012, primarily reflects an increase
in net payments on vehicle borrowings in 2013, partially offset by an increase in net proceeds from corporate
borrowings to fund the acquisition of Zipcar.
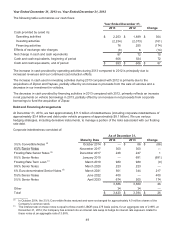
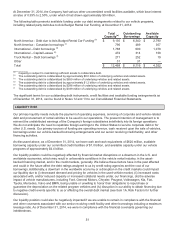
Debt and Financing Arrangements
At December 31, 2014, we had approximately $11.5 billion of indebtedness (including corporate indebtedness of
approximately $3.4 billion and debt under vehicle programs of approximately $8.1 billion). We use various
hedging strategies, including derivative instruments, to manage a portion of the risks associated with our floating
rate debt.
Corporate indebtedness consisted of:
As of December 31,
Maturity Date 2014 2013 Change
3½% Convertible Notes (a) October 2014 $ — $ 66 $ (66)
November 2017 300 300 —
Floating Rate Senior Notes (b) December 2017 248 247 1
8¼% Senior Notes January 2019 — 691 (691)
Floating Rate Term Loan (c) March 2019 980 989 (9)
9¾% Senior Notes March 2020 223 223 —
6% Euro-denominated Senior Notes (d) March 2021 561 344 217
June 2022 400 — 400
5½% Senior Notes April 2023 674 500 174
3,386 3,360 26
Other 34 34 —
Total $ 3,420 $ 3,394 $ 26
__________
(a) In October 2014, the 3½% Convertible Notes matured and were exchanged for approximately 4.0 million shares of the
Company’s common stock.
(b) The interest rate on these notes is equal to three-month LIBOR plus 275 basis points, for an aggregate rate of 2.98% at
December 31, 2014; the Company has entered into an interest rate swap to hedge its interest rate exposure related to
these notes at an aggregate rate of 3.58%.