Avis 2014 Annual Report Download - page 52
Download and view the complete annual report
Please find page 52 of the 2014 Avis annual report below. You can navigate through the pages in the report by either clicking on the pages listed below, or by using the keyword search tool below to find specific information within the annual report.-
 1
1 -
2
-
3
-
4
-
5
-
6
-
7
-
8
-
9
-
10
-
11
-
12
-
13
-
14
-
15
-
16
-
17
-
18
-
19
-
20
-
21
-
22
-
23
-
24
-
25
-
26
-
27
-
28
-
29
-
30
-
31
-
32
-
33
-
34
-
35
-
36
-
37
-
38
-
39
-
40
-
41
-
 42
42 -
 43
43 -
 44
44 -
 45
45 -
 46
46 -
 47
47 -
 48
48 -
 49
49 -
 50
50 -
 51
51 -
 52
52 -
 53
53 -
 54
54 -
 55
55 -
 56
56 -
 57
57 -
 58
58 -
 59
59 -
 60
60 -
 61
61 -
 62
62 -
63
-
64
-
65
-
66
-
67
-
68
-
69
-
70
-
71
-
72
-
73
-
74
-
75
-
76
-
77
-
78
-
79
-
80
-
81
-
82
-
83
-
84
-
85
-
86
-
87
-
88
-
89
-
90
-
91
-
92
-
93
-
94
-
95
-
96
-
97
-
98
-
99
-
100
-
101
-
102
-
103
-
104
-
105
-
106
-
107
-
108
-
109
-
110
-
111
-
112
-
113
-
114
-
115
-
116
-
117
-
118
-
119
-
120
-
121
-
122
-
123
-
124
-
125
-
126
-
127
-
128
-
129
-
130
-
131
-
132
-
133
-
134
-
135
-
136
-
137
 |
 |

45
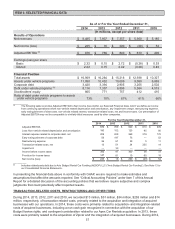
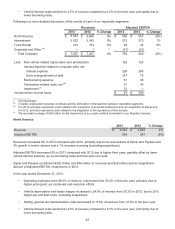
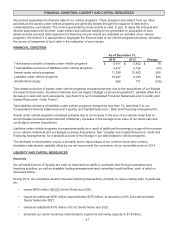
• Vehicle interest costs declined to 3.3% of revenue compared to 4.0% in the prior year, principally due to
lower borrowing rates.
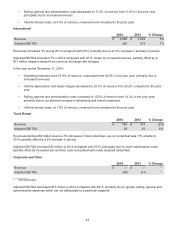
Following is a more detailed discussion of the results of each of our reportable segments:
Revenues Adjusted EBITDA
2013 2012 % Change 2013 2012 % Change
North America $ 5,042 $ 4,640 9% $ 508 $ 557 (9%)
International 2,522 2,342 8% 272 270 1%
Truck Rental 373 374 0% 36 34 6%
Corporate and Other (a) —1* (47) (21) *
Total Company $ 7,937 $ 7,357 8% 769 840 (8%)
Less: Non-vehicle related depreciation and amortization 152 125
Interest expense related to corporate debt, net:
Interest expense 228 268
Early extinguishment of debt 147 75
Restructuring expense 61 38
Transaction-related costs, net (b) 51 34
Impairment (c) 33 —
Income before income taxes $ 97 $ 300
__________
* Not meaningful
(a) Includes unallocated corporate overhead and the elimination of transactions between reportable segments.
(b) For 2013, primarily represents costs related to the integration of acquired businesses and our acquisition of Zipcar and,
for 2012, primarily represents costs related to the integration of the operations of Avis Europe.
(c) We recorded a charge of $33 million for the impairment of our equity-method investment in our Brazilian licensee.
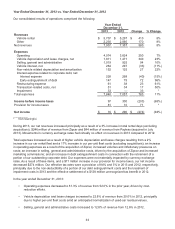
North America
2013 2012 % Change
Revenue $ 5,042 $ 4,640 9%
Adjusted EBITDA 508 557 (9%)
Revenues increased 9% in 2013 compared with 2012, primarily due to the acquisitions of Zipcar and Payless and
3% growth in rental volumes and a 1% increase in pricing (excluding acquisitions).
Adjusted EBITDA decreased 9% in 2013 compared with 2012 due to higher fleet costs, partially offset by lower
vehicle interest expense, as our borrowing rates declined year-over-year.
Zipcar and Payless contributed $205 million and $44 million to revenues and $26 million and an insignificant
amount to Adjusted EBITDA, respectively, in 2013.
In the year ended December 31, 2013:
• Operating expenses were 49.4% of revenue, a decrease from 50.4% in the prior year, primarily due to
higher pricing and our continued cost-reduction efforts.
• Vehicle depreciation and lease charges increased to 24.9% of revenue from 20.3% in 2012, due to 25%
higher per-unit fleet costs, excluding acquisitions.
• Selling, general and administrative costs decreased to 11.6% of revenue from 12.0% in the prior year.
• Vehicle interest costs declined to 4.0% of revenue compared to 5.3% in the prior year, principally due to
lower borrowing rates.