Avis 2014 Annual Report Download - page 51
Download and view the complete annual report
Please find page 51 of the 2014 Avis annual report below. You can navigate through the pages in the report by either clicking on the pages listed below, or by using the keyword search tool below to find specific information within the annual report.-
 1
1 -
2
-
3
-
4
-
5
-
6
-
7
-
8
-
9
-
10
-
11
-
12
-
13
-
14
-
15
-
16
-
17
-
18
-
19
-
20
-
21
-
22
-
23
-
24
-
25
-
26
-
27
-
28
-
29
-
30
-
31
-
32
-
33
-
34
-
35
-
36
-
37
-
38
-
39
-
40
-
 41
41 -
 42
42 -
 43
43 -
 44
44 -
 45
45 -
 46
46 -
 47
47 -
 48
48 -
 49
49 -
 50
50 -
 51
51 -
 52
52 -
 53
53 -
 54
54 -
 55
55 -
 56
56 -
 57
57 -
 58
58 -
 59
59 -
 60
60 -
 61
61 -
62
-
63
-
64
-
65
-
66
-
67
-
68
-
69
-
70
-
71
-
72
-
73
-
74
-
75
-
76
-
77
-
78
-
79
-
80
-
81
-
82
-
83
-
84
-
85
-
86
-
87
-
88
-
89
-
90
-
91
-
92
-
93
-
94
-
95
-
96
-
97
-
98
-
99
-
100
-
101
-
102
-
103
-
104
-
105
-
106
-
107
-
108
-
109
-
110
-
111
-
112
-
113
-
114
-
115
-
116
-
117
-
118
-
119
-
120
-
121
-
122
-
123
-
124
-
125
-
126
-
127
-
128
-
129
-
130
-
131
-
132
-
133
-
134
-
135
-
136
-
137
 |
 |

44
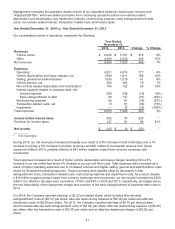
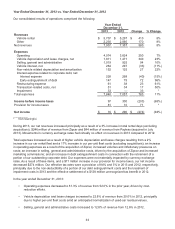
Year Ended December 31, 2013 vs. Year Ended December 31, 2012
Our consolidated results of operations comprised the following:
Year Ended
December 31,
2013 2012 Change % Change
Revenues
Vehicle rental $ 5,707 $ 5,297 $ 410 8%
Other 2,230 2,060 170 8%
Net revenues 7,937 7,357 580 8%
Expenses
Operating 4,074 3,824 250 7%
Vehicle depreciation and lease charges, net 1,811 1,471 340 23%
Selling, general and administrative 1,019 925 94 10%
Vehicle interest, net 264 297 (33) (11%)
Non-vehicle related depreciation and amortization 152 125 27 22%
Interest expense related to corporate debt, net:
Interest expense 228 268 (40) (15%)
Early extinguishment of debt 147 75 72 96%
Restructuring expense 61 38 23 61%
Transaction-related costs, net 51 34 17 50%
Impairment 33 — 33 *
Total expenses 7,840 7,057 783 11%
Income before income taxes 97 300 (203) (68%)
Provision for income taxes 81 10 71 *
Net income $ 16 $ 290 $ (274) (94%)
__________
* Not meaningful.
During 2013, our net revenues increased principally as a result of a 3% increase in total rental days (excluding
acquisitions), $246 million of revenue from Zipcar and $44 million of revenue from Payless (acquired in July
2013). Movements in currency exchange rates had virtually no effect on revenues in 2013 compared to 2012.
Total expenses increased as a result of higher vehicle depreciation and lease charges resulting from a 2%
increase in our car rental fleet and a 17% increase in our per-unit fleet costs (excluding acquisitions); an increase
in operating expenses as a result of the acquisition of Zipcar, increased volumes and inflationary pressures on
costs; an increase in selling, general and administrative costs, driven by the acquisition of Zipcar and increased
marketing commissions; and an increase in debt extinguishment costs in connection with the retirement of a
portion of our outstanding corporate debt. Our expenses were not materially impacted by currency exchange
rates. As a result of these items, and a $71 million increase in our provision for income taxes, our net income
decreased $274 million. Our effective tax rates were a provision of 84% and 3% in 2013 and 2012, respectively,
principally due to the non-deductibility of a portion of our debt extinguishment costs and the treatment of
impairment costs in 2013 and the effective settlement of a $128 million unrecognized tax benefit in 2012.
In the year ended December 31, 2013:
• Operating expenses decreased to 51.3% of revenue from 52.0% in the prior year, driven by cost-
reduction efforts.
• Vehicle depreciation and lease charges increased to 22.8% of revenue from 20.0% in 2012, principally
due to higher per-unit fleet costs amid an anticipated normalization of used-car residual values.
• Selling, general and administrative costs increased to 12.8% of revenue from 12.6% in 2012.