U-Haul 2009 Annual Report Download - page 96
Download and view the complete annual report
Please find page 96 of the 2009 U-Haul annual report below. You can navigate through the pages in the report by either clicking on the pages listed below, or by using the keyword search tool below to find specific information within the annual report.-
 1
1 -
2
-
3
-
4
-
5
-
6
-
7
-
8
-
9
-
10
-
11
-
12
-
13
-
14
-
15
-
16
-
17
-
18
-
19
-
20
-
21
-
22
-
23
-
24
-
25
-
26
-
27
-
28
-
29
-
30
-
31
-
32
-
33
-
34
-
35
-
36
-
37
-
38
-
39
-
40
-
41
-
42
-
43
-
44
-
45
-
46
-
47
-
48
-
49
-
50
-
51
-
52
-
53
-
54
-
55
-
56
-
57
-
58
-
59
-
60
-
61
-
62
-
63
-
64
-
65
-
66
-
67
-
68
-
69
-
70
-
71
-
72
-
73
-
74
-
75
-
76
-
77
-
78
-
79
-
80
-
81
-
82
-
83
-
84
-
85
-
 86
86 -
 87
87 -
 88
88 -
 89
89 -
 90
90 -
 91
91 -
 92
92 -
 93
93 -
 94
94 -
 95
95 -
 96
96 -
 97
97 -
 98
98 -
 99
99 -
 100
100 -
 101
101 -
 102
102 -
 103
103 -
 104
104 -
 105
105 -
 106
106 -
107
-
108
-
109
-
110
-
111
-
112
-
113
-
114
-
115
-
116
-
117
-
118
-
119
-
120
-
121
-
122
-
123
-
124
-
125
-
126
-
127
-
128
 |
 |

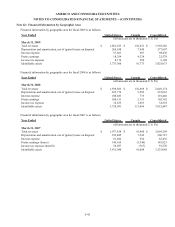
AMERCO AND CONSOLIDATED ENTITIES
NOTES TO CONSOLIDATED FINANCIAL STATEMENTS -- (CONTINUED)
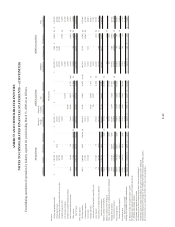
Note 22: Financial Information by Geographic Area
Financial information by geographic area for fiscal 2009 is as follows:
Year Ended United States Canada Consolidated
March 31, 2009
Total revenues $ 1,881,635 $ 110,631 $ 1,992,266
Depreciation and amortization, net of (gains) losses on disposal 269,658 7,949 277,607
Interest expense 97,863 607 98,470
Pretax earnings 18,254 4,324 22,578
Income tax expense 8,174 994 9,168
Identifiable assets 3,733,300 91,773 3,825,073
(All amounts are in thousands U.S. $'s)
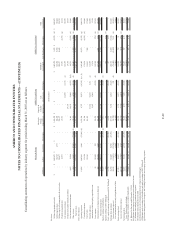
Financial information by geographic area for fiscal 2008 is as follows:
Year Ended United States Canada Consolidated
March 31, 2008
Total revenues $ 1,938,505 $ 110,669 $ 2,049,174
Depreciation and amortization, net of (gains) losses on disposal 225,774 9,289 235,063
Interest expense 100,685 735 101,420
Pretax earnings 100,151 2,151 102,302
Income tax expense 32,855 1,663 34,518
Identifiable assets 3,720,991 111,496 3,832,487
(All amounts are in thousands U.S. $'s)
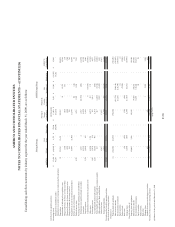
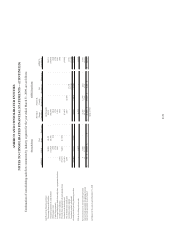
Financial information by geographic area for fiscal 2007 is as follows:
Year Ended United States Canada Consolidated
March 31, 2007
Total revenues $ 1,977,818 $ 91,480 $ 2,069,298
Depreciation and amortization, net of (gains) losses on disposal 199,485 7,242 206,727
Interest expense 81,882 554 82,436
Pretax earnings (losses) 149,169 (3,346) 145,823
Income tax expense (benefit) 56,037 (767) 55,270
Identifiable assets 3,431,960 91,088 3,523,048
(All amounts are in thousands U.S. $'s)
F-41