U-Haul 2009 Annual Report Download - page 38
Download and view the complete annual report
Please find page 38 of the 2009 U-Haul annual report below. You can navigate through the pages in the report by either clicking on the pages listed below, or by using the keyword search tool below to find specific information within the annual report.-
 1
1 -
2
-
3
-
4
-
5
-
6
-
7
-
8
-
9
-
10
-
11
-
12
-
13
-
14
-
15
-
16
-
17
-
18
-
19
-
20
-
21
-
22
-
23
-
24
-
25
-
26
-
27
-
 28
28 -
 29
29 -
 30
30 -
 31
31 -
 32
32 -
 33
33 -
 34
34 -
 35
35 -
 36
36 -
 37
37 -
 38
38 -
 39
39 -
 40
40 -
 41
41 -
 42
42 -
 43
43 -
 44
44 -
 45
45 -
 46
46 -
 47
47 -
 48
48 -
49
-
50
-
51
-
52
-
53
-
54
-
55
-
56
-
57
-
58
-
59
-
60
-
61
-
62
-
63
-
64
-
65
-
66
-
67
-
68
-
69
-
70
-
71
-
72
-
73
-
74
-
75
-
76
-
77
-
78
-
79
-
80
-
81
-
82
-
83
-
84
-
85
-
86
-
87
-
88
-
89
-
90
-
91
-
92
-
93
-
94
-
95
-
96
-
97
-
98
-
99
-
100
-
101
-
102
-
103
-
104
-
105
-
106
-
107
-
108
-
109
-
110
-
111
-
112
-
113
-
114
-
115
-
116
-
117
-
118
-
119
-
120
-
121
-
122
-
123
-
124
-
125
-
126
-
127
-
128
 |
 |
34
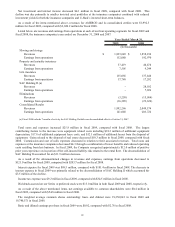
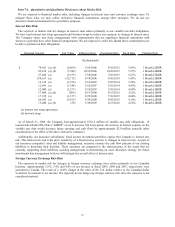
Net capital expenditures (purchases of property, plant and equipment less proceeds from the sale of property, plant
and equipment) were $268.5 million, $402.8 million and $557.5 million for fiscal 2009, 2008 and 2007,
respectively. During fiscal 2009, 2008 and 2007, the Company entered into $285.5 million, $129.1 million and
$120.6 million, respectively, of new equipment operating leases.
Moving and Storage continues to hold significant cash and has access to additional liquidity. Management may
invest these funds in our existing operations, expand our product lines or pursue external opportunities in the self-
moving and storage market place.
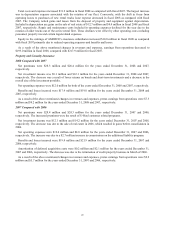
Property and Casualty Insurance
State insurance regulations restrict the amount of dividends that can be paid to stockholders of insurance
companies. As a result, Property and Casualty Insurance’s assets are generally not available to satisfy the claims of
AMERCO or its legal subsidiaries.
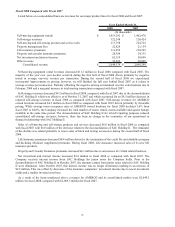
Stockholder’s equity was $147.9 million, $148.6 million, and $142.4 million at December 31, 2008, 2007, and
2006, respectively. The decrease resulted from earnings of $5.0 million offset by a dividend paid to AMERCO of
$5.5 million and a decrease in other comprehensive income of $3.7 million. Property and Casualty Insurance does
not use debt or equity issues to increase capital and therefore has no direct exposure to capital market conditions
other than through its investment portfolio. During fiscal 2009, ARCOA was capitalized by AMERCO in the
amount of $3.5 million.
Life Insurance
Life Insurance manages its financial assets to meet policyholder and other obligations including investment
contract withdrawals. Life Insurance’s net withdrawals for the year ending December 31, 2008 were $35.9 million.
State insurance regulations restrict the amount of dividends that can be paid to stockholders of insurance companies.
As a result, Life Insurance’s funds are generally not available to satisfy the claims of AMERCO or its legal
subsidiaries.
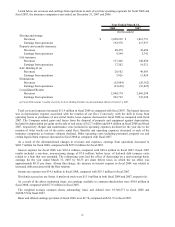
Life Insurance’s stockholder’s equity was $156.7 million, $150.7 million, and $136.4 million at December 31,
2008, 2007 and 2006, respectively. The increase resulted from earnings of $11.2 million and a $5.2 million decrease
in other comprehensive income. Life Insurance does not use debt or equity issues to increase capital and therefore
has no direct exposure to capital market conditions other than through its investment portfolio.
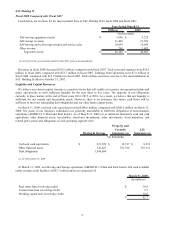
Cash Provided from Operating Activities by Operating Segments
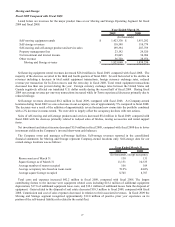
Moving and Self-Storage
Cash provided by operating activities was $272.5 million, $324.4 million and $331.7 million in fiscal 2009, 2008
and 2007, respectively. Fiscal 2008 included a $20.0 million payment from SAC Holdings reducing their
outstanding note payable with AMERCO. The decrease in self-moving equipment rental revenues and product and
service sales is a principal contributor to the decline in operating cash flows.
Property and Casualty Insurance
Cash provided (used) by operating activities was ($1.3) million, ($4.0) million, and $5.4 million for the years
ending December 31, 2008, 2007, and 2006, respectively.
Property and Casualty Insurance’s cash and cash equivalents and short-term investment portfolios amounted to
$112.0 million, $79.3 million, and $71.9 million at December 31, 2008, 2007, and 2006, respectively. This balance
reflects funds in transition from maturity proceeds to long term investments. Management believes this level of
liquid assets, combined with budgeted cash flow, is adequate to meet periodic needs. Capital and operating budgets
allow Property and Casualty Insurance to schedule cash needs in accordance with investment and underwriting
proceeds.
Life Insurance
Cash provided by operating activities from Life Insurance were $3.7 million, $7.1 million and $11.4 million for
the years ending December 31, 2008, 2007 and 2006, respectively. The decrease from 2008 compared with 2007
was the result of a cash payment to a third party insurer for the cession of a portion of Oxford’s disability business.
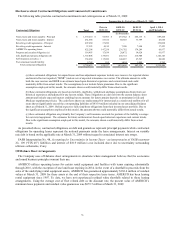
In addition to cash flows from operating activities and financing activities, a substantial amount of liquid funds are
available through Life Insurance’s short-term portfolio. At December 31, 2008, 2007 and 2006, cash and cash
equivalents and short-term investments amounted to $39.3 million, $37.7 million and $41.4 million, respectively.
Management believes that the overall sources of liquidity will continue to meet foreseeable cash needs.