U-Haul 2009 Annual Report Download - page 104
Download and view the complete annual report
Please find page 104 of the 2009 U-Haul annual report below. You can navigate through the pages in the report by either clicking on the pages listed below, or by using the keyword search tool below to find specific information within the annual report.-
 1
1 -
2
-
3
-
4
-
5
-
6
-
7
-
8
-
9
-
10
-
11
-
12
-
13
-
14
-
15
-
16
-
17
-
18
-
19
-
20
-
21
-
22
-
23
-
24
-
25
-
26
-
27
-
28
-
29
-
30
-
31
-
32
-
33
-
34
-
35
-
36
-
37
-
38
-
39
-
40
-
41
-
42
-
43
-
44
-
45
-
46
-
47
-
48
-
49
-
50
-
51
-
52
-
53
-
54
-
55
-
56
-
57
-
58
-
59
-
60
-
61
-
62
-
63
-
64
-
65
-
66
-
67
-
68
-
69
-
70
-
71
-
72
-
73
-
74
-
75
-
76
-
77
-
78
-
79
-
80
-
81
-
82
-
83
-
84
-
85
-
86
-
87
-
88
-
89
-
90
-
91
-
92
-
93
-
 94
94 -
 95
95 -
 96
96 -
 97
97 -
 98
98 -
 99
99 -
 100
100 -
 101
101 -
 102
102 -
 103
103 -
 104
104 -
 105
105 -
 106
106 -
 107
107 -
 108
108 -
 109
109 -
 110
110 -
 111
111 -
 112
112 -
 113
113 -
 114
114 -
115
-
116
-
117
-
118
-
119
-
120
-
121
-
122
-
123
-
124
-
125
-
126
-
127
-
128
 |
 |

AMERCO AND CONSOLIDATED ENTITIES
NOTES TO CONSOLIDATED FINANCIAL STATEMENTS -- (CONTINUED)
F-49
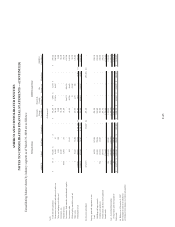
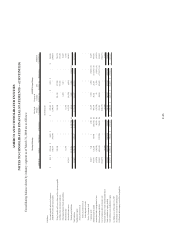
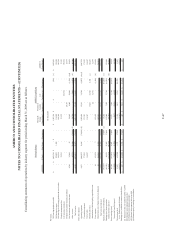
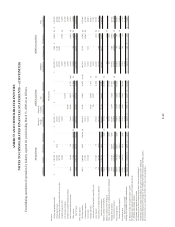
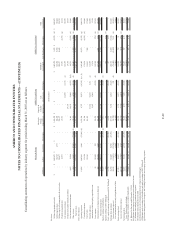
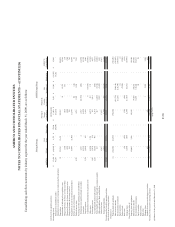
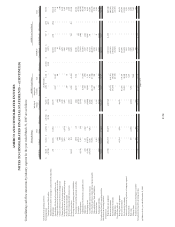
Consolidating statements of operations by industry segment for period ending March 31, 2007 are as follows:
AMERCO U-Haul Real Estate Eliminations
Moving &
Storage
Consolidated
Property &
Casualty
Insurance (a)
Life
Insurance (a) Eliminations
AMERCO
Consolidated SAC Holding II Eliminations
Total
Consolidated
Revenues:
Self-moving equipment rentals -$ 1,462,470$ -$ -$ 1,462,470$ -$ -$ -$ 1,462,470$ 9,225$ (9,225)$ (b) 1,462,470$
Self-storage revenues - 104,725 1,773 - 106,498 - - - 106,498 19,926 - 126,424
Self-moving & self-storage products & service sales - 208,677 - - 208,677 - - - 208,677 16,045 - 224,722
Property management fees - 23,951 - - 23,951 - - - 23,951 - (2,797) (g) 21,154
Life insurance premiums - - - - - - 121,590 (1,191) (c) 120,399 - - 120,399
Property and casualty insurance premiums - - - - - 24,335 - - 24,335 - - 24,335
Net investment and interest income 4,867 29,294 - - 34,161 14,151 22,490 (4,071) (b,d) 66,731 - (7,035) (d) 59,696
Other revenue 204 31,403 67,436 (73,049) (b) 25,994 - 4,740 (1,333) (b) 29,401 1,407 (710) (b) 30,098
Total revenues 5,071 1,860,520 69,209 (73,049) 1,861,751 38,486 148,820 (6,595) 2,042,462 46,603 (19,767) 2,069,298
Costs and expenses:
Operating expenses 12,096 1,085,619 8,843 (73,049) (b) 1,033,509 8,787 30,871 (10,765) (b, c, d) 1,062,402 22,573 (2,797) (g) 1,082,178
Commission expenses - 172,124 - - 172,124 - - - 172,124 - (9,225) (b) 162,899
Cost of sales - 110,163 - - 110,163 - - - 110,163 7,485 - 117,648
Benefits and losses - - - - - 21,901 88,347 6,711 (c) 116,959 - - 116,959
Amortization of deferred policy acquisition costs - - - - - 2,057 15,081 - 17,138 - - 17,138
Lease expense 88 149,649 853 - 150,590 - - (2,221) (b) 148,369 - (710) (b) 147,659
Depreciation, net of (gains) losses on disposals 293 180,560 6,605 - 187,458 - - - 187,458 2,691 (560) (e) 189,589
Total costs and expenses 12,477 1,698,115 16,301 (73,049) 1,653,844 32,745 134,299 (6,275) 1,814,613 32,749 (13,292) 1,834,070
Equity in earnings of subsidiaries 35,269 - - (25,766) (f) 9,503 - - (9,503) (f) - - - -
Equity in earnings of SAC Holding II 527 - - - 527 - - - 527 - (527) (f) -
Total - equity in earnings of subsidiaries and SAC Holding II 35,796 - - (25,766) 10,030 - - (9,503) 527 - (527) -
Earnings from operations 28,390 162,405 52,908 (25,766) 217,937 5,741 14,521 (9,823) 228,376 13,854 (7,002) 235,228
Interest income (expense) 89,026 (114,051) (51,704) - (76,729) - - 320 (d) (76,409) (13,062) 7,035 (d) (82,436)
Fees and amortization on early extinguishment of debt - (302) (6,667) - (6,969) - - - (6,969) - - (6,969)
Pretax earnings (loss) 117,416 48,052 (5,463) (25,766) 134,239 5,741 14,521 (9,503) 144,998 792 33 145,823
Income tax benefit (expense) (27,211) (17,948) 1,125 - (44,034) (5,896) (4,863) - (54,793) (265) (212) (e) (55,270)
Net earnings (loss) 90,205 30,104 (4,338) (25,766) 90,205 (155) 9,658 (9,503) 90,205 527 (179) 90,553
Less: Preferred stock dividends (12,963) - - - (12,963) - - - (12,963) - - (12,963)
Earn
i
ngs
(l
oss
)
ava
il
a
bl
e to common s
h
are
h
o
ld
ers 77,242$ 30,104$ (4,338)$ (25,766)$ 77,242$ (155)$ 9,658$ (9,503)$ 77,242$ 527$ (179)$ 77,590$
(a) Balances for the year ended December 31, 2006
(b) Eliminate intercompany lease income and commission income
(c ) Eliminate intercompany premiums and expenses
(d) Eliminate intercompany interest on debt
(e) Eliminate gain on sale of surplus property from U-Haul to SAC Holding II
(f) Eliminate equity in earnings of subsidiaries and equity in earnings of SAC Holding II
(g) Eliminate management fees charged to SAC Holding II and other intercompany operating expenses
(In thousands)
Moving & Storage AMERCO Legal Group AMERCO as Consolidated