U-Haul 2009 Annual Report Download - page 59
Download and view the complete annual report
Please find page 59 of the 2009 U-Haul annual report below. You can navigate through the pages in the report by either clicking on the pages listed below, or by using the keyword search tool below to find specific information within the annual report.-
 1
1 -
2
-
3
-
4
-
5
-
6
-
7
-
8
-
9
-
10
-
11
-
12
-
13
-
14
-
15
-
16
-
17
-
18
-
19
-
20
-
21
-
22
-
23
-
24
-
25
-
26
-
27
-
28
-
29
-
30
-
31
-
32
-
33
-
34
-
35
-
36
-
37
-
38
-
39
-
40
-
41
-
42
-
43
-
44
-
45
-
46
-
47
-
48
-
 49
49 -
 50
50 -
 51
51 -
 52
52 -
 53
53 -
 54
54 -
 55
55 -
 56
56 -
 57
57 -
 58
58 -
 59
59 -
 60
60 -
 61
61 -
 62
62 -
 63
63 -
 64
64 -
 65
65 -
 66
66 -
 67
67 -
 68
68 -
 69
69 -
70
-
71
-
72
-
73
-
74
-
75
-
76
-
77
-
78
-
79
-
80
-
81
-
82
-
83
-
84
-
85
-
86
-
87
-
88
-
89
-
90
-
91
-
92
-
93
-
94
-
95
-
96
-
97
-
98
-
99
-
100
-
101
-
102
-
103
-
104
-
105
-
106
-
107
-
108
-
109
-
110
-
111
-
112
-
113
-
114
-
115
-
116
-
117
-
118
-
119
-
120
-
121
-
122
-
123
-
124
-
125
-
126
-
127
-
128
 |
 |

F-4
2009 2008 2007
Revenues:
Self-moving equipment rentals $ 1,423,022 $ 1,451,292 $ 1,462,470
Self-storage revenues 110,548 122,248 126,424
Self-moving and self-storage products and service sales 199,394 217,798 224,722
Property management fees 23,192 22,820 21,154
Life insurance premiums 109,572 111,996 120,399
Property and casualty insurance premiums 28,337 28,388 24,335
Net investment and interest income 58,021 62,110 59,696
Other revenue 40,180 32,522 30,098
Total revenues 1,992,266 2,049,174 2,069,298
Costs and expenses:
082,178
Comm 162,899
Cost of sales 117,648
116,959
Amor 17,138
Leas 147,659
Depreciation, 189,589
834,070
Earnings fr 235,228
In 82,436)
Fees (6,969)
Pretax ear 145,823
Income 55,270)
Net earn 90,553
Less: Pr 12,963)
Earnin 77,590
Basic 3.72
Weight 838,570
Years Ended March 31,
(In thousands, except share and per share data)
Related party revenues for fiscal 2009, 2008 and 2007, net of eliminations, were $46.9 million, $42.5 million and $33.5 million, respectively.
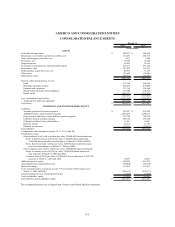
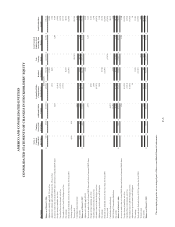
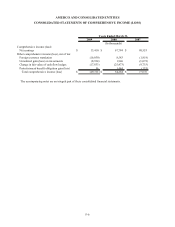
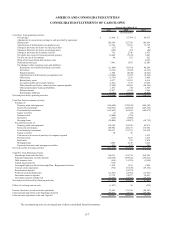
The accompanying notes are an integral part of these consolidated financial statements.
Related party costs and expenses for fiscal 2009, 2008 and 2007, net of eliminations, were $37.1 million, $31.8 million and $28.0 million,
respectively.
Operating expenses 1,047,238 1,079,486 1,
ission expenses 171,303 167,945
114,387 120,210
Benefits and losses 108,259 108,817
tization of deferred policy acquisition costs 12,394 13,181
e expense 152,424 133,931
net of (gains) losses on disposals 265,213 221,882
Total costs and expenses 1,871,218 1,845,452 1,
om operations 121,048 203,722
terest expense (98,470) (101,420) (
and amortization on early extinguishment of debt - -
nings 22,578 102,302
tax expense (9,168) (34,518) (
ings 13,410 67,784
eferred stock dividends (12,963) (12,963) (
gs available to common shareholders $ 447 $ 54,821 $
and diluted earnings per common share $ 0.02 $ 2.78 $
ed average common shares outstanding: Basic and diluted 19,350,041 19,740,571 20,
CONSOLIDATED STATEMENTS OF OPERATIONS
AMERCO AND CONSOLIDATED ENTITIES